
Graphing My Feelings
Years ago, I wrote letters back and forth with someone who would draw their feelings when they had trouble expressing themself in words. Their letters would include elaborate, abstract doodles that, if I’m being honest, did little to help me understand how they were doing. Nevertheless, I was inspired to try to draw my feelings. The problem was, every time I tried to draw my feelings, I ended up accidentally graphing them instead. Whatever first stroke was meant to begin my drawing would inevitably start to trace the arc of a feeling over time (the invisible horizontal axis, apparently).
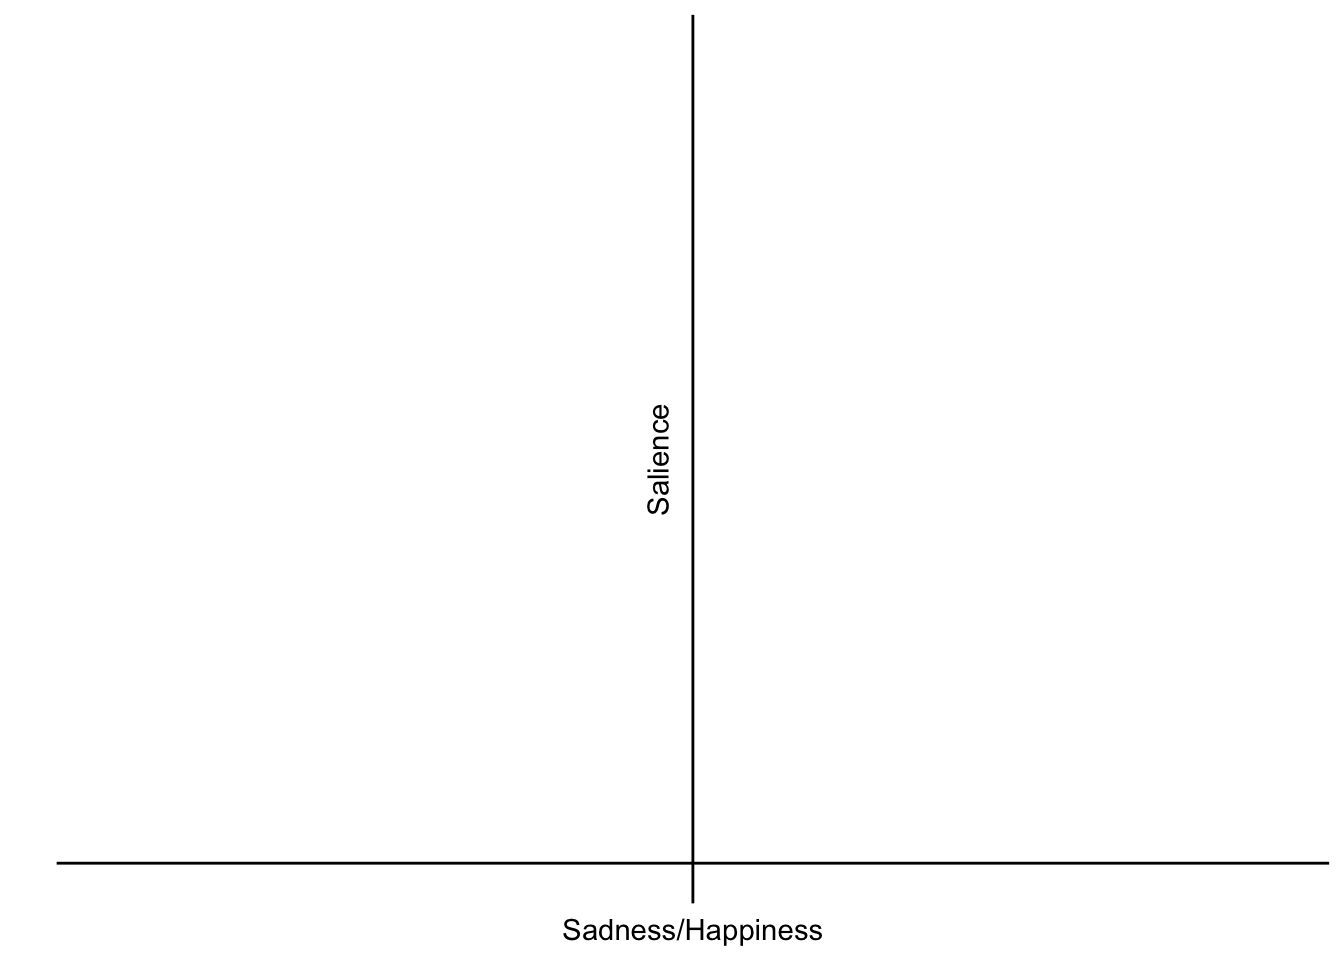
So I decided to graph my feelings intentionally. I didn’t just want to graph a single feeling over time, I wanted to represent a snapshot of the things I had feelings about and what those feelings were at one point in time. I don’t remember devising the x- and y-axes; they just were the axes in my head. The x-axis represented how happy/good (positive values) or sad/bad (negative values) the emotion was. The y-axis represented how salient the emotion was, essentially how much something was on my mind, or how strong the emotion was when I thought about it.1 The y-axis only stretches in the positive direction. Both axes are logarithmic.
Here’s a blank example graph:
Then, I would plot whatever was on my mind.
I’ve graphed my feelings periodically over the decade or so since I first gave up on drawing my feelings. For this post, I went through my old journals and found some of the feelings graphs I’ve done over the years.
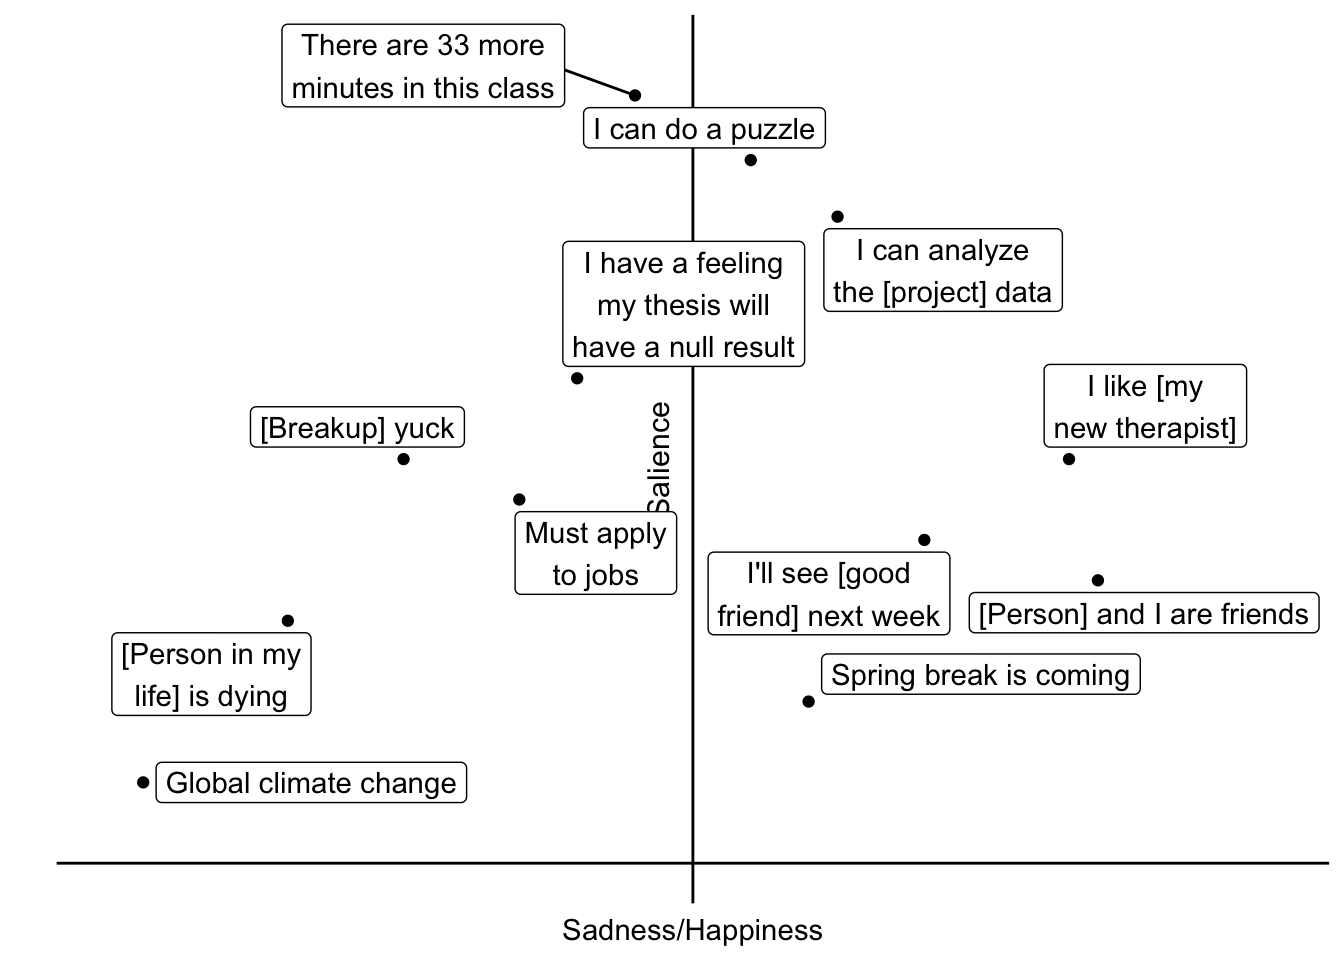
I found one unfinished graph with a single data point: “must apply to jobs.” Apparently facing this reality was so overwhelming, I abandoned the rest of the graph. At some point I took to anchoring the graphs with the point “global climate change” in the bottom left corner; it’s objectively very bad, but not very on my mind. Below is a graph with these two points and a collection of other things I plotted over the years together on one set of axes.
As in the graph above, the points in my feelings graphs tend to fall approximately within the blue triangle below.
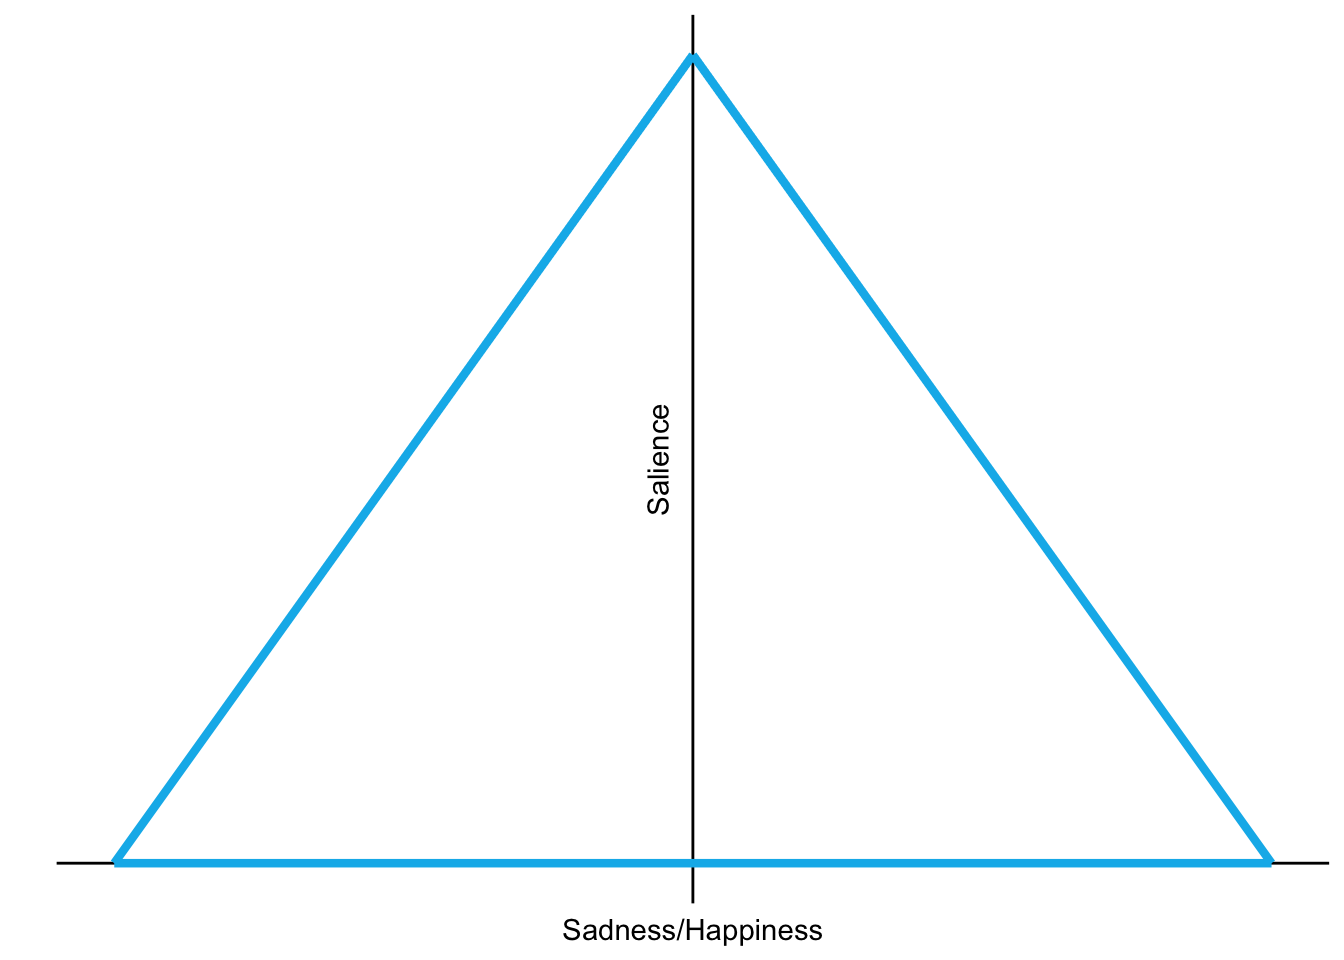
Generally, the feelings with the highest salience are neither very happy nor very sad. What is top of mind at any given moment tends to be completely mundane. Conversely, the most sad or most happy things I plot tend to be further from my consciousness. Perhaps this is the result of a coping strategy—those things which might elicit the strongest positive or negative emotions can’t remain salient to us or they would take over everything. But of course, there are times when something very happy or very sad is at the forefront of our consciousness, and these things do take over everything. Someone close to us dies. We get laid off. Someone we have feelings for rejects us. We have a falling out with a person we love. We get married. We graduate. We visit someone we haven’t seen in years and really missed. We move to a new city. Our regular internal lives, those balanced triangles, are eclipsed.
Two dimensions
I love to think about how we might plot complex, multidimensional things on x-y coordinate planes. I believe there is something beautiful about distilling something complex down to two dimensions. We can see two dimensions in a way that we can’t see more than two. We glance at a page and instantly deduce the precise relationships between the data points. Sure, we can add other dimensions to visualizations–color, size, shape–but we can’t see these other dimensions with the precision and immediacy and clarity that we can see points on a page. That’s why I sometimes graph my feelings in two dimensions.
Yet, the x-axis in my feelings graphs has been assigned an impossible task: capture the quality of every feeling along a single line. Obviously, feelings are more than just happy or sad. The intention of the axis is to ask, “does this thing make me feel good or bad?” But I think I’m sometimes really asking, “do I think that this thing is a good or bad thing, no matter how I actually feel about it?” It’s so much harder and more complicated to decipher actual feelings than it is to intellectually appraise something. My feelings graphs, I realized writing this, do little to capture or convey actual feelings.
Psychologists have proposed different sets of “primary emotions.” The sets differ somewhat, but they generally include fear, anger, joy, sadness, disgust, contempt, and surprise. Seven dimensions. If only we could see in 7 dimensions, it would be really cool to graph our feelings.
Thematic Clusters
There tend to be clusters of thematically similar feelings in different sections of my feelings graphs. I’ve attempted to characterize those sections on the graph below.
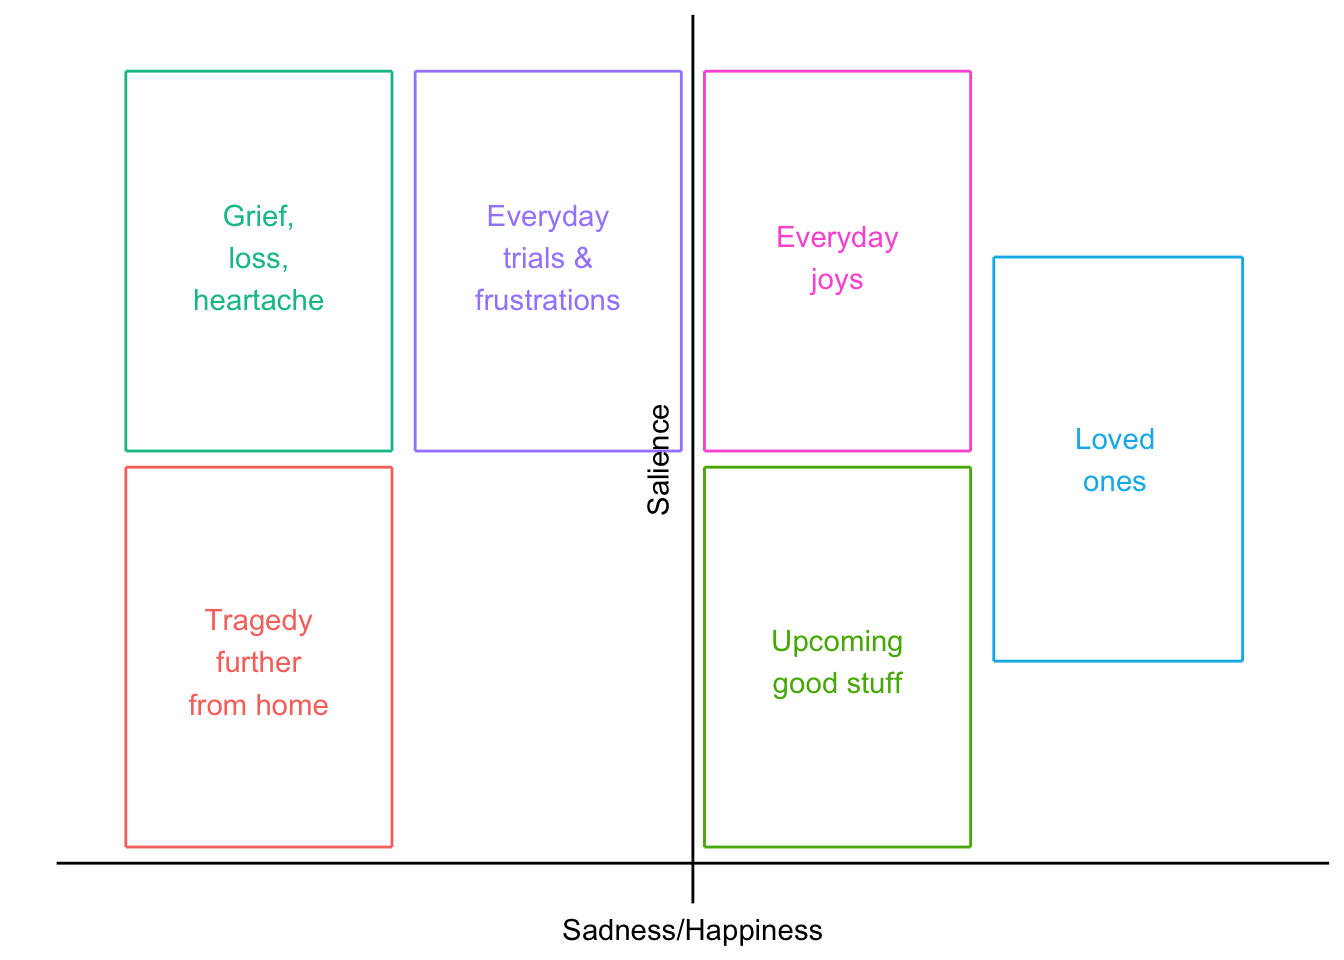
I wasn’t sure what to put in the blank spaces on the graph. There’s nothing in the slightly sad and slightly salient corner. I guess things that are not that bad and not that salient generally don’t feel worth plotting. There’s also a gap in the very happy and very salient, but not in the very sad and very salient. It strikes me how suddenly and absolutely things can fall apart in our lives, but there are rarely positive equivalents. Of course, really good things happen to us, but I think they tend to happen more gradually and less unexpectedly. Relationships can end so suddenly, but cultivating them is something that takes effort and time. Maybe there’s nothing up there in the super good and super salient because we have more agency in the good things; we build them.
A Third Dimension?
An extension I’ve sometimes considered is how one point might travel over time. Take a big loss for example. It might start out very salient and very sad, then bob up and down in salience as time goes on and we are reminded of the loss. Maybe it’s a rhythmic oscillation, rising every year at the anniversary of the loss, or the person’s birthday. Does the loss become less sad over time, or just less salient? I’m not sure.
The beauty of adding a third dimension such as time is that we can create something three dimensional. I’ve imagined sculptures representing things that happened to us and how we felt about them over time. One could do an exhibition of something like grief, showing the sculptures of different people’s experiences. Or one could do something more frivolous. A sculpture for every research paper I’ve written, for example, would get a lot of movement in both happiness/sadness and salience.
I’m curious, if you graphed your feelings in 2 dimensions, what would you choose as axes? If you added a third dimension (besides time) to my proposed axes, what dimension would you add?
P.S. As usual, here’s a link to download my code.
P.P.S. If you would like to receive an email when I publish a new post, please fill out this google form.
I found that the amount something was on my mind and the strength of the feelings when pondering that thing tended to be highly correlated, so they could be combined into one axis.↩︎