
Personalities in My Network of Friends, Roommates, and Partners, Part I: The People
In high school, I used to joke that I could predict who I would end up being friends with by asking whether they’d ever been in a relationship and how old they were when they got a cell phone. My friends were the chronically single, late cell phone type.
Of course, whether someone has a significant other or a cell phone doesn’t go very far in capturing them as a whole person, but perhaps these two metrics did illustrate something meaningful about whether or not I would end up being friends with them in the divided world of public high school.
There’s a set of related questions that I think about frequently: can we capture someone’s character using data? And if so, how many dimensions does it take?
I find personality types fascinating. Whoever came up with the Myers-Briggs Type Indicator basically said, “people can actually be summarized by 4 binary dimensions,” and the world said, “yes, so true!” and then started typing each other to decide whom to hire or date. Personality types are the quintessence of so many things I love and love to hate: people, data, acronyms, the condensation of complex information down to simplistic categories.
So, I asked my community to take 3 personality tests and send me their results. By community, I mean the network of roommates, friends, and partners connected to me in Boston. Everyone I invited to participate was welcome to invite any of their roommates, friends, and partners living in Boston to do the same. To be clear, this network is not my COVID pod; many of the people connected to each other in this diagram are not having in-person contact because of the pandemic.
The Network
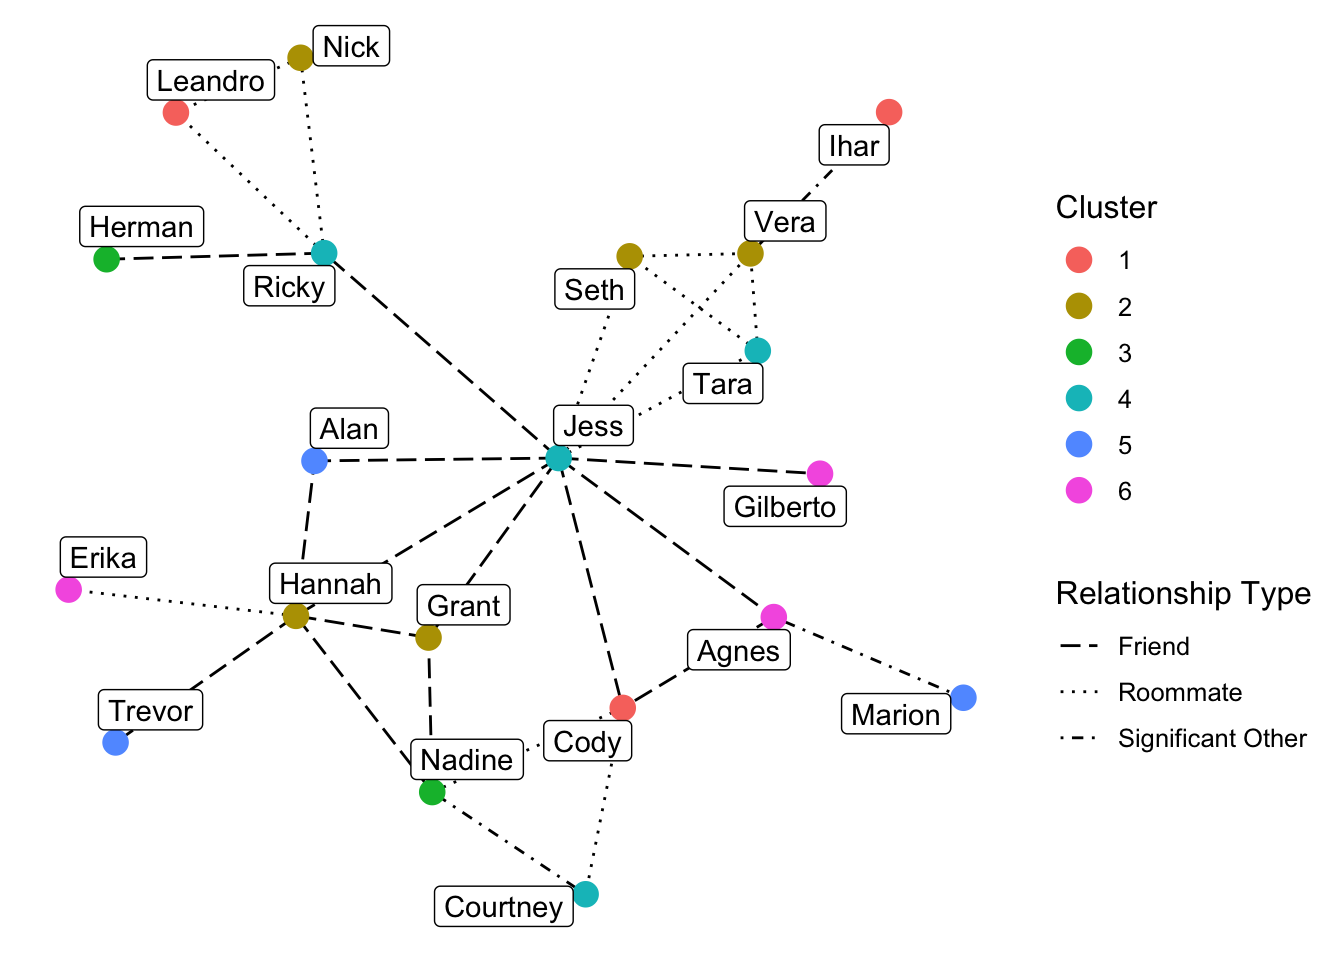
Overall, 20 people completed the tests. Below is a network diagram showing the relationships between the people, with different line types for friends, roommates, and significant others. To protect people’s privacy, I used a random name generator to replace everyone’s name except mine.
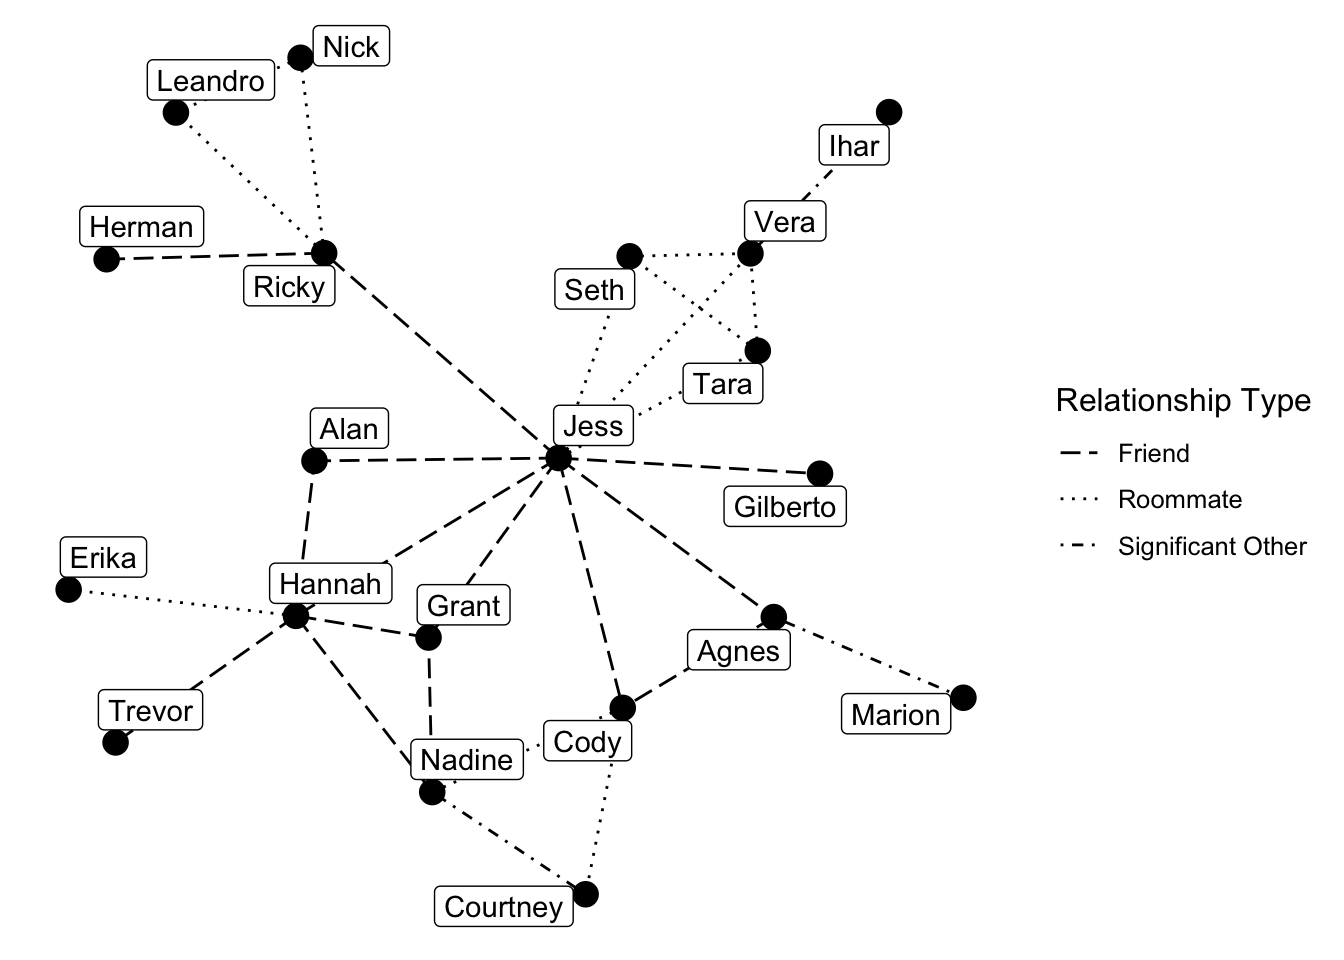
Because the data set is so small, the analyses I’m about to do lack sufficient power to make sweeping conclusions. I’m just looking for trends among the 20 of us. It’s just for fun.
The Personality Tests
- Myers-Briggs Type Indicator: I had people take the questionnaire here. It has 4 binary dimensions described below, from this site. In creating the data set, I picked one end of each dimension to be a 0 and the other to be a 4, so each person had a 0 or a 4 for each dimension depending on which end they fall on.
- Introversion (4) vs. Extraversion (0) (E vs. I) describes how a person gets energized
- Sensing (4) vs. Intuition (0) (S vs. N) describes how a person takes in information
- Thinking (4) vs. Feeling (0) (T vs. F) describes the means a person uses to make decisions
- Perceiving (4) vs. Judging (0) (J vs. P) describes the speed with which a person makes decisions
- Big Five Personality Traits: I had people take this questionnaire. The traits are openness to new experience, conscientiousness, extroversion, agreeableness, and neuroticism. I asked people for their ranking of these 5 traits from highest (coded in the data set as a 4) to lowest (coded in the data set as a 0). The 5 traits are described further below, taken from this site:
- Openness to experience (inventive/curious vs. consistent/cautious)
- Conscientiousness (efficient/organized vs. extravagant/careless)
- Extraversion (outgoing/energetic vs. solitary/reserved)
- Agreeableness (friendly/compassionate vs. critical/rational)
- Neuroticism (sensitive/nervous vs. resilient/confident)
- Enneagram Type Indicator: I had people take this Enneagram questionnaire. Enneagram has 9 personality types labeled with numbers. I asked people to tell me their top 3 personality types in order. These were coded in the data set as 4, 3, and 2, and the other types were all coded as 0’s. Here are the descriptions of each type from this site:
- Type 1 = The Perfectionist: Principled, Purposeful, Self-Controlled, and Perfectionistic
- Type 2 = The Helper: Demonstrative, Generous, People-Pleasing, and Possessive
- Type 3 = The Achiever: Adaptive, Excelling, Driven, and Image-Conscious
- Type 4 = The Individualist: Expressive, Dramatic, Self-Absorbed, and Temperamental
- Type 5 = The Investigator: Perceptive, Innovative, Secretive, and Isolated
- Type 6 = The Loyalist: Engaging, Responsible, Anxious, and Suspicious
- Type 7 = The Enthusiast: Spontaneous, Versatile, Distractible, and Scattered
- Type 8 = The Challenger: Self-Confident, Decisive, Willful, and Confrontational
- Type 9 = The Peacemaker: Receptive, Reassuring, Agreeable, and Complacent
Based on these 3 personality tests, each person has a score on each of 18 dimensions (4 from Myers-Briggs, 5 from The Big Five, and 9 from Enneagram). Each score is an ordinal rating between 0 and 4.
Our Collective Personalities
Okay, so, who are we? I visualized our collective data to get a sense of what we tended to have in common.
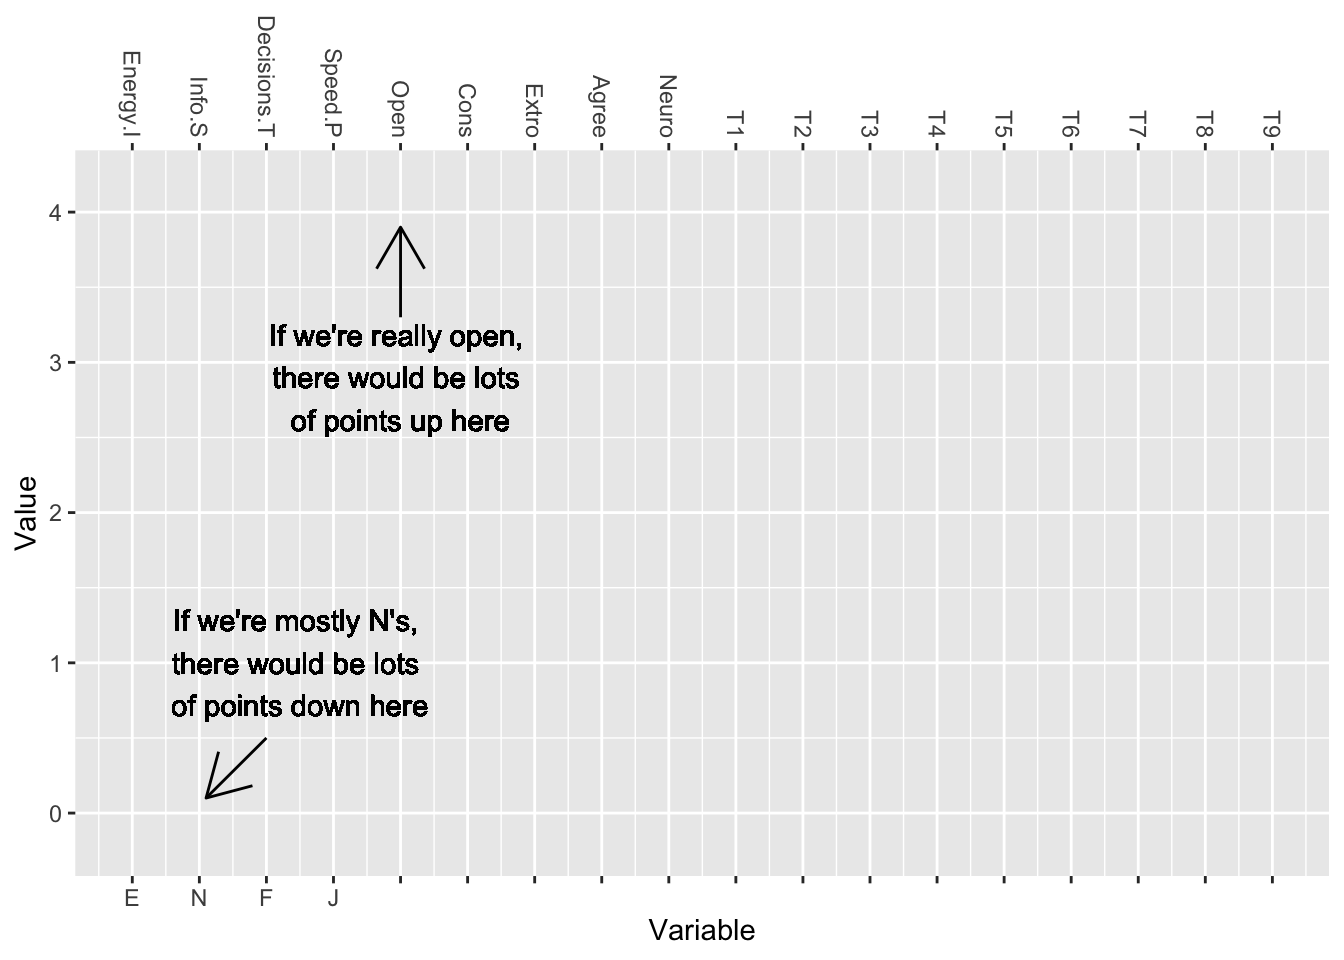
First, I plotted each of the 18 dimensions on the x-axis (first 4 are Myers-Briggs, the next 5 are The Big Five, and the last 9 are the Enneagram). The values are on the y-axis. Here’s a blank plot to get used to.
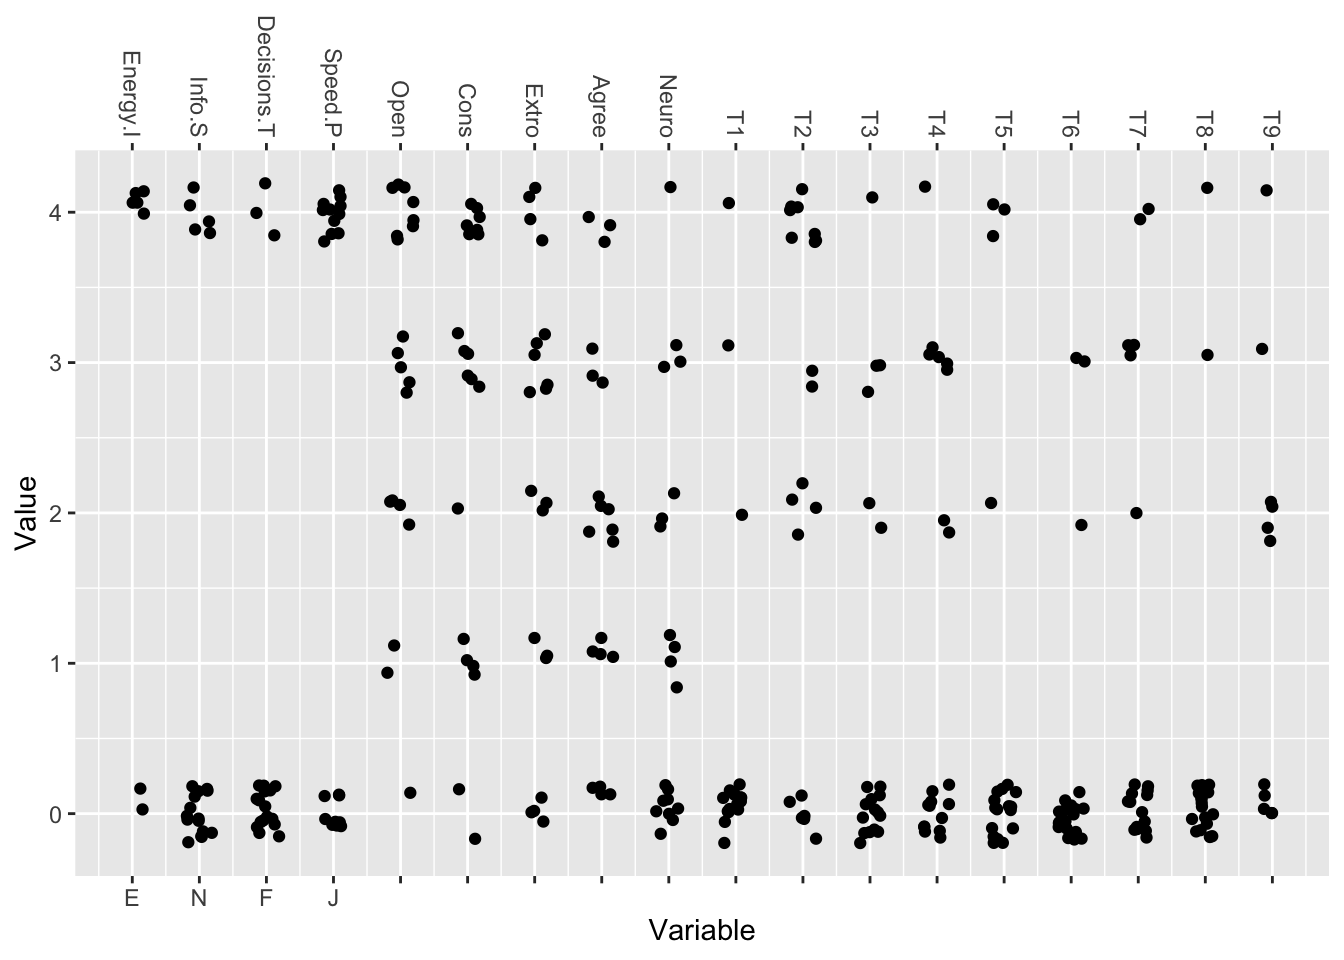
Next, I plotted each person’s responses with a jitter so you can differentiate the points (as I mentioned, each value is a 0, 1, 2, 3, or 4 for each variable).
This is really hard to read, so I added some summary statistics. I added a big purple point at the average for each variable. I also added horizontal lines at the expected average for each variable, if the personalities were totally random and all choices were equally likely.1 A line connects the expected average to the actual average. Thus, taller lollipops show where our personalities show a stronger trend.
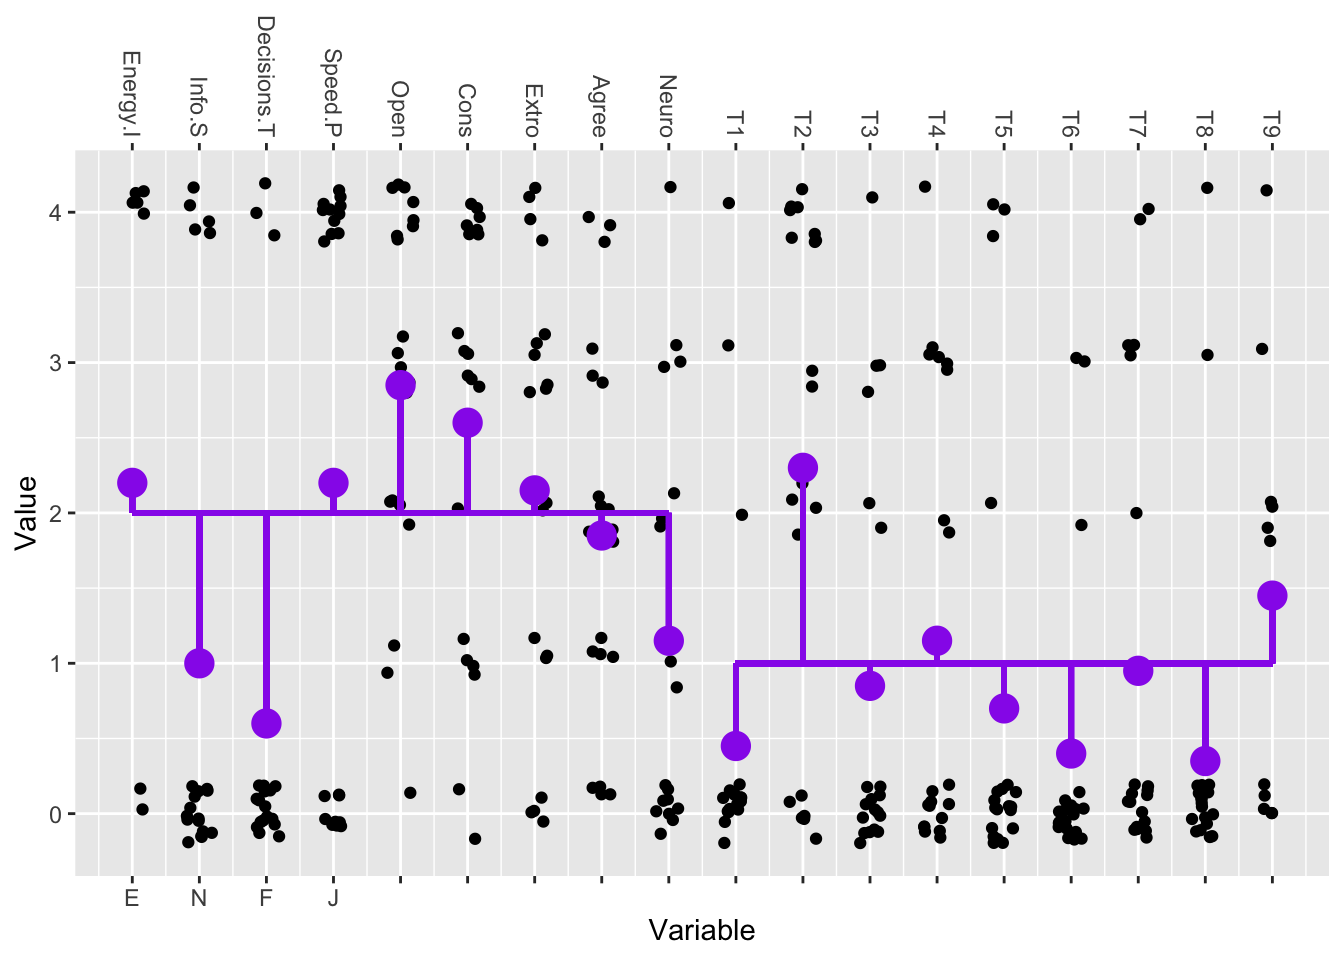
The strongest trends are as follows: we tend to use intuition (N) to take in information, rely on feelings (F) when making decisions, and our Enneagram type is overwhelmingly Type 2, “The Helper: Demonstrative, Generous, People-Pleasing, and Possessive.” Of note, I’m a Myers-Briggs N and F and my top Enneagram type is “The Helper.”
Differentiating Our Personalities
I wondered if the network could be cleanly split into discrete groups of people with similar personalities within each group.
I performed k-means clustering with the optimal number of clusters chosen using the silhouette method. You can think of each person’s personality existing as a point in 18-dimensional space (the 18 dimensions being the 18 personality dimensions on the charts above). Some points are closer together and others are further apart. Clustering finds an optimal way to split the points into groups (clusters). Ideally, points within the same cluster would be very close together (have similar personalities) and each cluster would be somewhat far apart from every other cluster.
These data didn’t cluster very cleanly, meaning these 20 people can’t easily be divided into clusters with similar personalities within clusters and big differences in personalities between clusters. That being said, here’s the clustering that was produced, with the 20 people divided into 6 clusters:
Understanding the Clusters
To try to understand which variables define each cluster, I created a similar plot to the one with the purple lollipops above. This time, each cluster has its own panel. Now, the point shows the average for that variable within the cluster, and the stick goes from the average for all 20 people to the average for that cluster. This time, long sticks mean the average for that cluster is very different from the average for the 20 people overall.2

After carefully examining this plot, I picked out what seem to be the important variables distinguishing each cluster and chose a descriptor based on this information.
- Cluster 1: The Practical Peacemakers - They use senses to take in information and they’re high in Enneagram Type 9 (The Peacemaker: Receptive, Reassuring, Agreeable, and Complacent)
- Cluster 2: The Curious Helpers - They are very high in Enneagram Type 2 and score highly on openness to new experiences. They’re also high in introversion.
- Cluster 3: The Driven Givers - They’re high in both Enneagram Type 2 (The Helper: Demonstrative, Generous, People-Pleasing, and Possessive) and Type 3 (The Achiever: Adaptive, Excelling, Driven, and Image-Conscious).
- Cluster 4: The Extroverted Adventurers - They’re high in Enneagram Type 7 (The Enthusiast: Spontaneous, Versatile, Distractible, and Scattered) and extroversion, both in The Big Five and Myers-Briggs. They’re also high in Enneagram Type 2 (The Helper: Demonstrative, Generous, People-Pleasing, and Possessive).
- Cluster 5: The Logical Investigators - They rely on thinking (as opposed to feeling) to make decisions and they’re high in Enneagram Type 5 (Investigator: Perceptive, Innovative, Secretive, and Isolated).
- Cluster 6: The Introverted Individualists - They’re the most introverted of the clusters, considering both the Myers-Briggs introversion-extroversion dimension and the The Big Five extraversion dimension, and they’re high in Enneagram Type 4 (The Individualist: Expressive, Dramatic, Self-Absorbed, and Temperamental).
By the way, I did my best to label every cluster with positive or neutral descriptors. That’s one fascinating thing about personality types – the same traits can be framed in very positive or very negative terms. I opted for the positive. I’m in Cluster 3, The Driven Givers. I could have called us “The Image-conscious Micromanagers,” but where’s the fun in that?
Here’s the same plot again with the clusters labeled with the nicknames I gave them and stars indicating which variables I think are important in defining each cluster:

If you’re reading this and want to know which cluster you’d fit into (whether you live in Boston or not), fill out this Google form and I’ll let you know! If enough extra people take the tests, I might re-cluster everyone and reproduce the analyses in another post.
In case you’re wondering if we’re meant to be friends, I should probably tell you I got a cell phone in 7th grade (when my parents said it was no longer optional) and didn’t date until I was 18.
Stay tuned for Part II: The Relationships.
P.S. As usual, here’s a link to download the code I used to make the graphs.
P.P.S. If you would like to receive an email when I publish a new post, please fill out this google form.
The expected average for the Enneagram types is a 1 because each person had one 4, one 3, one 2, and six 0’s for the nine types, so that averages out to (4 + 3 + 2) / 9 = 1↩︎
Because the Myers-Briggs dimensions are binary and every person has either a 0 or 4 on each dimension, the sticks for those dimensions can be deceptively long despite the dimensions possibly not being especially meaningful in defining the clusters.↩︎