
Visualizing a Year of Groceries: Round II
A few months ago, I accidentally bought sugar-free, fat-free pudding. It tasted terrible.
The pudding was an impulse buy. I was in the grocery store, found myself passing the pudding section, and remembered loving the pudding cups I had as a kid, so I bought a 4-pack. Except in the moments I stood in front of the arrangement of brown pudding and red logos, I struggled to identify the original variety. This is exactly the kind of moment that POTS makes challenging. I generally feel fine walking through the aisles, but standing still and deciding what to grab off the shelf sends my heart rate up and the blood in my body down into my legs and hands. I feel short of breath, it’s hard to think, and I rush to make a decision and keep walking. That’s how I ended up with a pack of pudding with a terrible fake-sugar aftertaste.
Being disabled is highly relevant to my experience buying, cooking, eating, and cleaning up from food (there’s the standing, the time and energy commitment, and the heavy bags of groceries that cause my wrists to pop out of place). The relevance of my disabilities to my love-hate-hate relationship with cooking seems perfectly obvious now, but it hadn’t occurred to me a year ago when I published a post celebrating feeding myself independently for a year. I spent so many years trying to make the way I felt make sense without a diagnosis, that now that I have one, there’s a lot to revise. The, “ohhh, that’s why this is/was so hard” moments are one of the most complicated aspects of navigating my diagnoses. They come with a fair amount of sadness and anger. But once I understand why something is hard, the ways to make it less hard become so much clearer, and I can approach the hard things with intentional self-compassion and a sense of humor.
Now I sit down when I chop vegetables and, when I need to carry groceries, I put the heaviest ones in my backpack. I still cut corners when I cook, but I’m getting better at cutting the right corners. For example, I recently learned that it’s okay to skip ingredients in a recipe, but less okay to skip all the spices (shoutout to my roommates’ horrified reactions to witnessing my cooking for really driving this point home).
This year in big cooking wins, I started setting timers when I leave something to cook instead of relying on instinct and coming back to soggy pasta 20 minutes later. In small wins, I started ordering groceries sometimes instead of going to the store (in small losses, last week they delivered ham instead of kale and my salad was just not the same). In big losses, I ate two corn tortillas before realizing the package was playing host to moth larvae.
Like last year, my data set is my cumulative grocery list for the year. It’s ordered, but there aren’t specific quantities or timestamps. Unlike last year, I planned to publish this post, so I was careful to record what I actually bought; I think this list is almost perfectly complete.
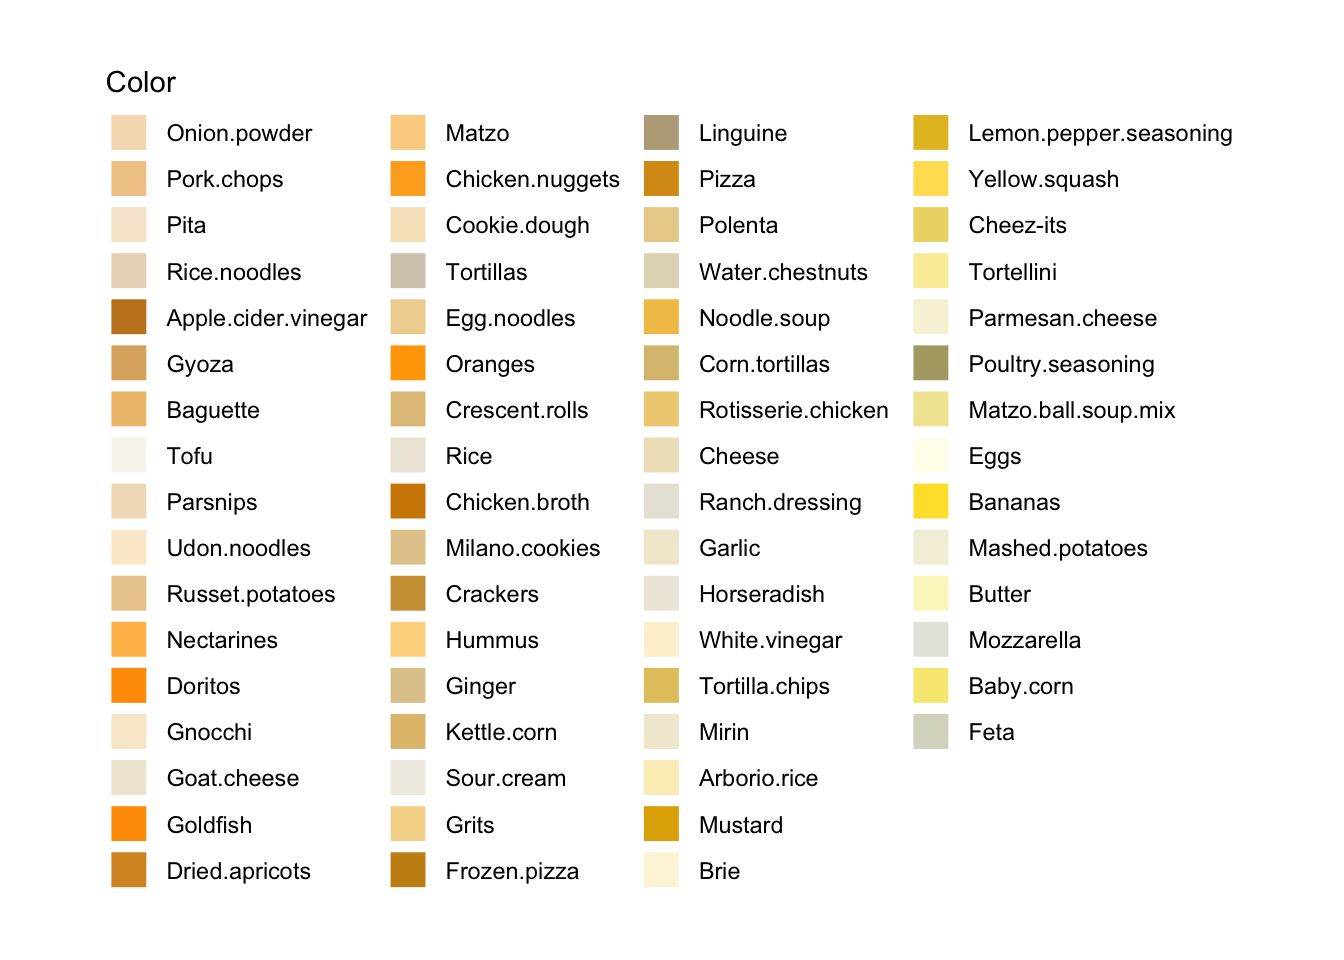
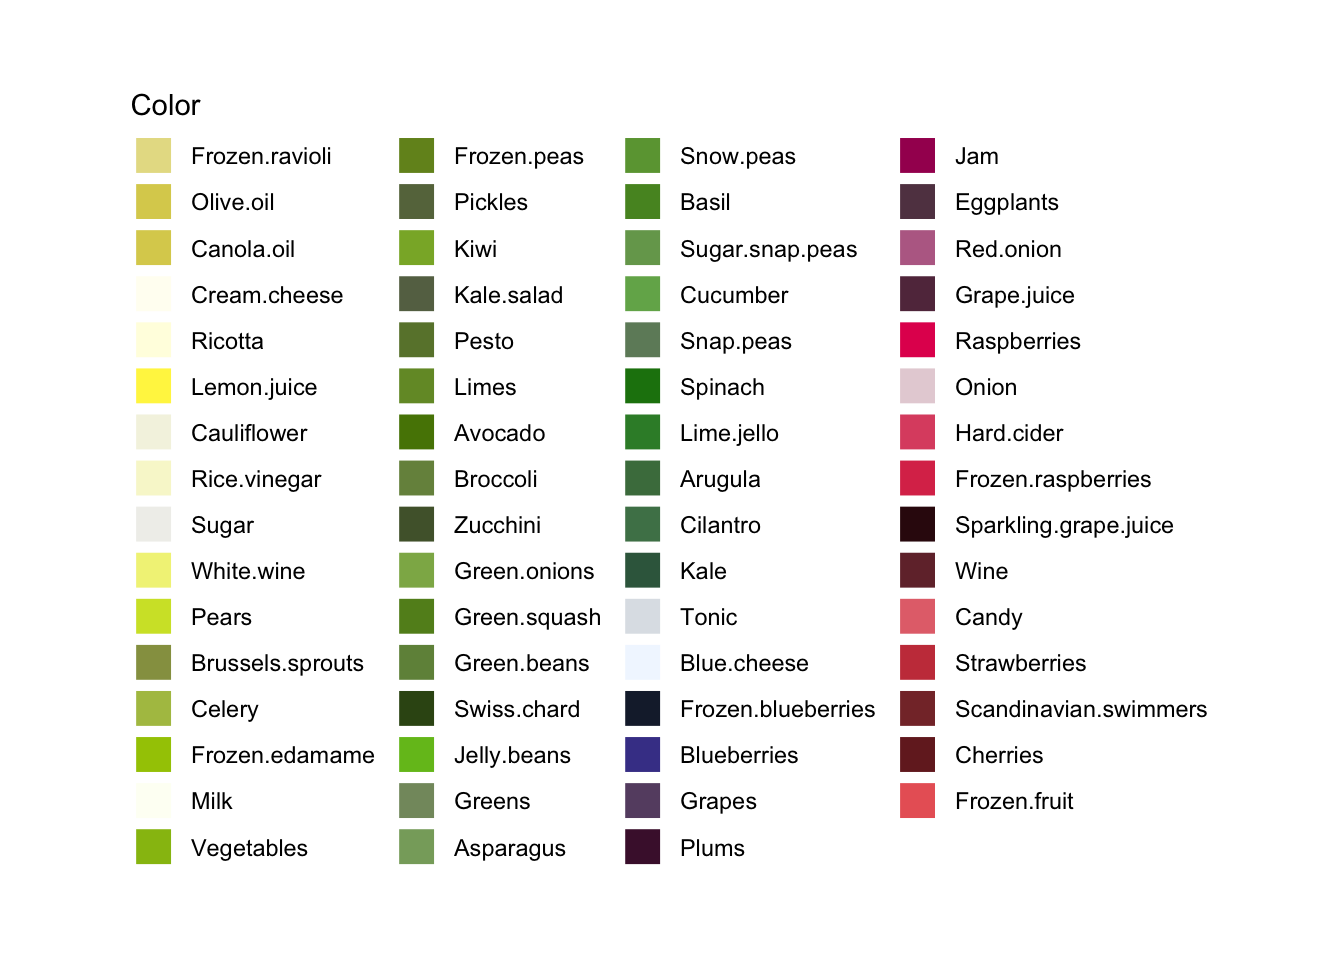
Last year, I assigned every grocery I bought a hue, attempting to make each color as accurate as possible. This year, I assigned a color to each of the 73 new foods I bought in year 2 that I hadn’t bought in year 1. Here’s the legend for all the foods I bought in either year, split into 3 parts so you can see everything:
## [1] "/Users/User/Documents/DataJournal/datajournal/content/post"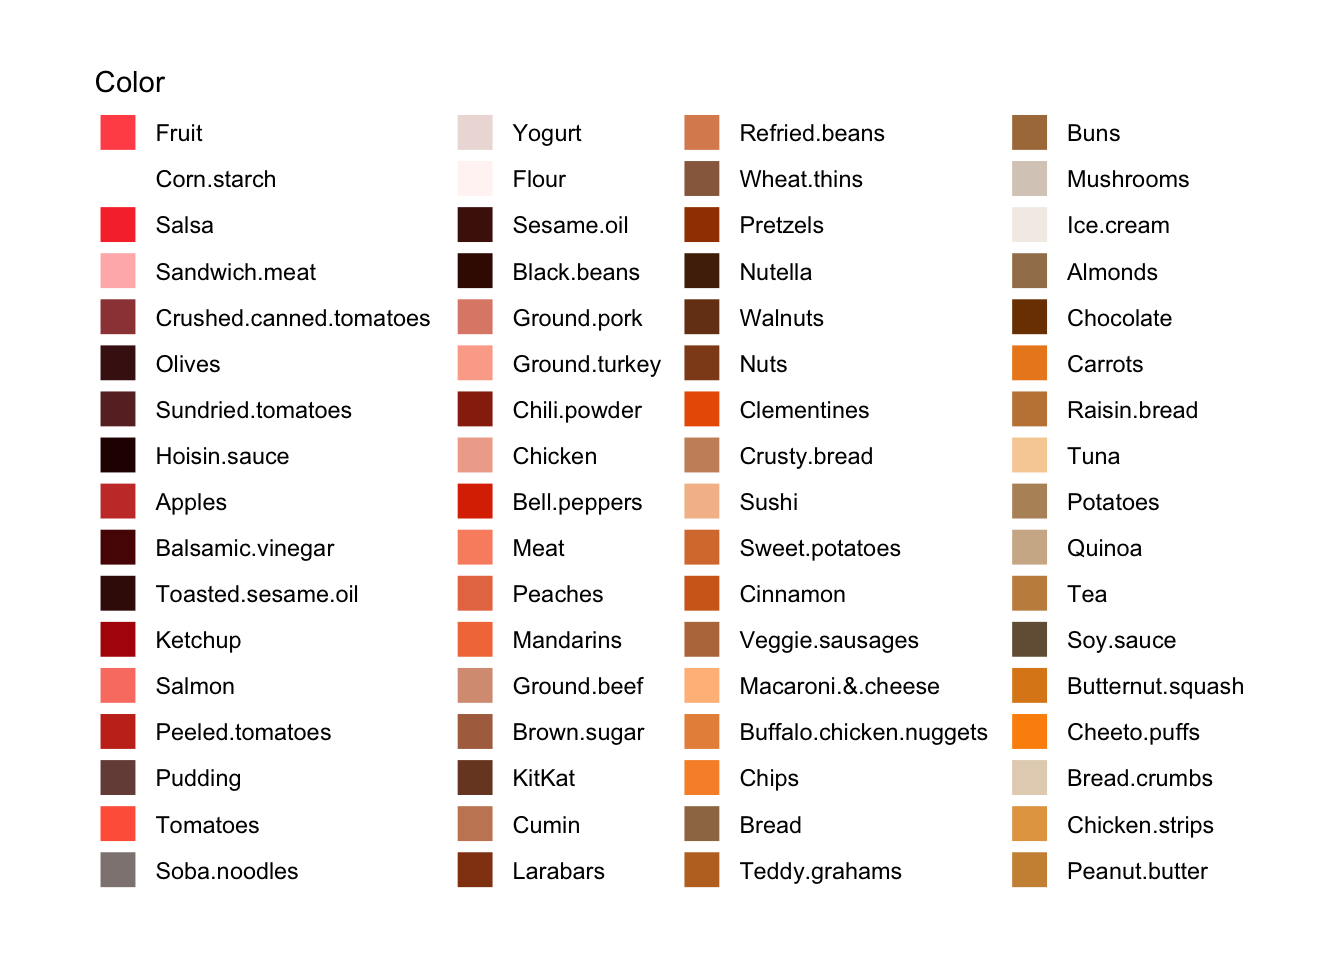
My first year feeding myself, I basically bought the same foods over and over. The top 20 items I bought made up 55% of the total items I purchased. Here’s the graph of all the foods I bought in year 1 in order (read like a calendar, from top left to bottom right):
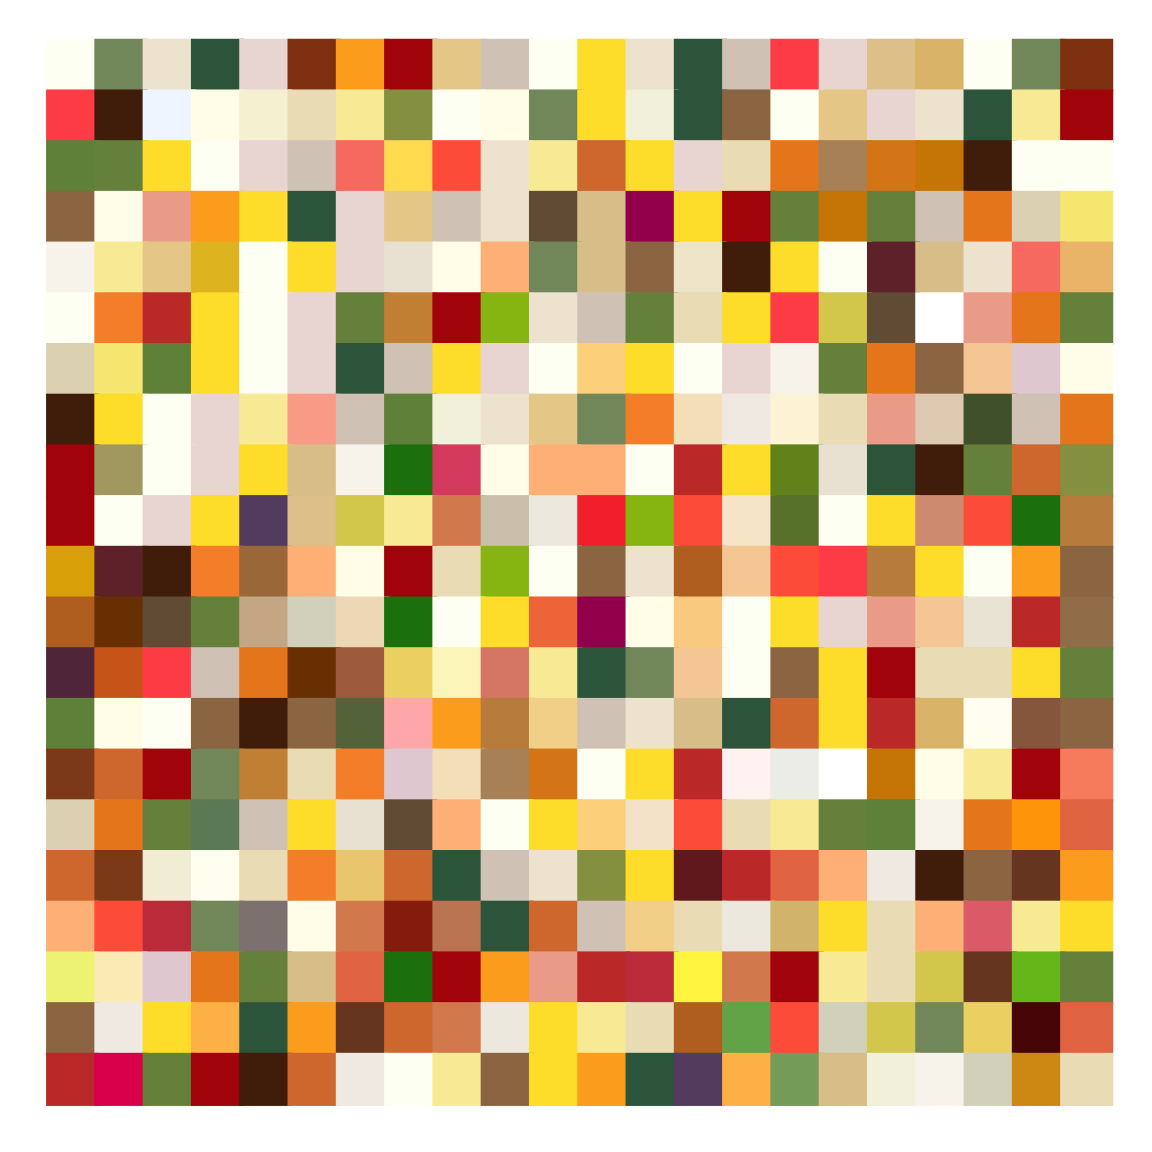
In year 2, I tried to embrace variety. Getting more comfortable cooking plus the changes I described above to make grocery shopping and cooking more accessible provided me with the extra bandwidth I needed to try out new recipes and rely less and less on making the same meals over and over. In year two, my top 20 foods made up 39% instead of 55% of the foods I purchased.
It’s also worth noting that knowing I would post this influenced my behavior. It was fun to use this post as an extra reason to buy things like blueberries and raspberries, which I knew would add brightness and variety to this graph.
Here’s the same graph for the foods I bought in year 2:
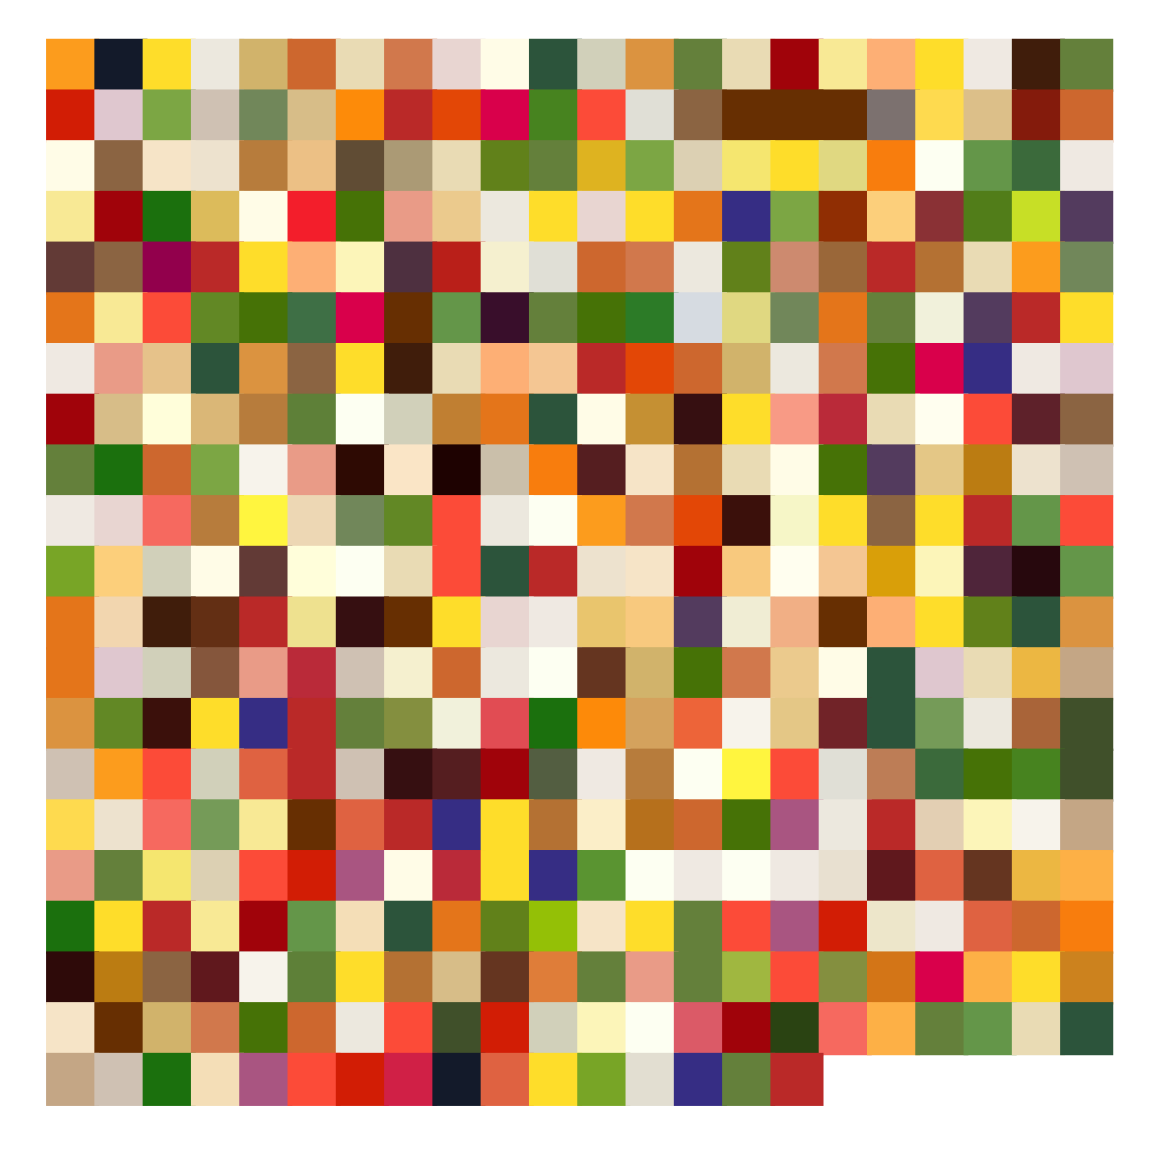
Way more colorful.
In case you’re looking for some inspiration, here are a few of my go-to recipes from the last year:
- Kale & quinoa salad with tofu and miso - I use microwavable quinoa to minimize time and effort
- Crispy sheet pan gnocchi and veggies - I like to add spinach on top of the other vegetables when roasting
- Sweet potato tacos - I recommend not eating any moth larvae
Bon appetit!
P.S. As usual, here’s a link to download my code.
P.P.S. If you would like to receive an email when I publish a new post, please fill out this google form.