
POTS, Sleep, and Completing the Stress Cycle: An Experiment
Have you ever wondered something causal about yourself and then realized the only way to satisfy your curiosity was to run an experiment and repeatedly randomize yourself to conditions? That’s how this whole thing started.
Introduction: POTS
I have POTS (postural orthostatic tachycardia syndrome), a form of autonomic nervous system dysfunction. The acronym roughly translates to “my heart beats too fast when I stand upright” in plain English. I explain having POTS like this: my body struggles to regulate itself. For people with POTS, automatic bodily processes sometimes malfunction a little (or a lot). These processes are things like sweating, crying, digesting food, and a particular struggle for me: sleeping.
I normally sleep well for a few hours. Then, my body gets confused and thinks it’s 3 in the afternoon instead of 3 in the morning and all of a sudden, for no apparent reason, I’m awake. Sometimes I’m able to go back to sleep relatively quickly, but other times I’m wide awake and convincing my body to slow down and drift off again is an extensive process. For a long time, I’ve wondered what causes some nights to be “good” nights, when I awaken briefly or not at all, and others to be “bad” nights, when I wander my apartment at 4am and catch up on the latest episodes of “The Daily.” 1
One evening last fall, I sat down to journal about something that was on my mind. I wrote down all my feelings, cried during the process, and then went to bed. I woke the next morning feeling great and couldn’t remember being awake at all during the night. My Fitbit labelled my sleep quality that night “excellent.” I hadn’t known that was even a category! My previous record was “good.”
Had I slept so well because of the writing and crying I’d done the evening before?
Although my autonomic nervous system dysfunction certainly contributes to my fragmented sleep, stress likely also plays a role (doesn’t it always?). I might have slept so well that night because I completed the stress cycle.
Introduction: The Stress Cycle
I learned about the stress cycle from Emily Nagoski’s excellent books Come As You Are and Burnout (co-authored with Amelia Nagoski). The basic premise is this: we encounter stressors (things that cause stress) every day. Often, the process of dealing with those stressors doesn’t actually deal with the stress they cause. So, after we give the presentation or make the phone call that was stressing us out, the stress is still in our bodies, and it takes separate action to process that stress so it leaves our bodies. This action to deal with the stress is how we complete the stress cycle.
I designed an experiment to answer this basic question: Does taking action to complete the stress cycle during the day help me be awake for less time during the night?
I know people for whom sleep is an afterthought, the thing they do when they’re done with all the other things. For me, sleep is the thing I do that enables all the other things. As a chronically ill person, I am all about understanding and working with my body and its needs. I put immense amounts of time and intention into my sleep. I chose this research question with two goals in mind: to sleep better, and to better understand myself.
Randomization, The Key to Disentangling Causality
Based on my night of “excellent” sleep, it seemed there might be an association between writing/crying and sleeping well. However, since I freely chose to write/cry, I couldn’t tell if the writing/crying caused the superb sleep. There could be some other thing correlated with both writing/crying and sleeping well that was actually causing both. That’s where randomization comes in. If you use a random process to determine a treatment condition (such as writing/crying or not writing/crying), then, if the treatment condition and an outcome variable are correlated, you can assume the treatment caused the outcome, since you know the treatment wasn’t correlated with anything else.
That’s the basic idea behind my experiment. For 113 days, I randomized myself to do or not do each of 4 activities. Then, I measured the effects of the activity assignments on my sleep.
The Activities
Emily and Amelia outline various ways to complete the stress cycle in Burnout. The list includes physical activity, breathing, positive social interaction, laughter, affection, “a big ol’ cry,” and creative expression (pgs. 15-19). For my experiment, I needed the activities to be accessible but not inevitable, so that I could do them when I was assigned to do them and not do them when I was assigned not to. This automatically excluded some activities from the list.2
From January 1 through May 17, 2020, I randomized myself to do or not do each of 4 activities 6 days a week. The seventh day was my day off, and I did whatever I wanted. Based on how often I could realistically do or not do the different activities, I assigned myself to each activity with a different probability. Here are the 4 activities: * Exercise - I operationalized physical activity as brisk walking for at least 30 minutes. Because I have Ehlers-Danlos syndrome, many forms of physical activity are off-limits to me, but brisk walking is something I can do most days. * Probability of being assigned to do this: ⅚. I know I need to exercise most days, so I randomized myself with a high probability of being assigned to do this each day. * Paint - My preferred form of creative expression is painting with watercolors. * Probability of being assigned to do this: ⅙. Painting is sort of a big time commitment, and I knew I wouldn’t realistically make time to do it much more often than once a week. * Write/cry - I couldn’t exactly assign myself to “a big ’ol cry,” since crying isn’t something we have total agency over. But I could randomize myself to write about whatever was most emotionally salient to me that day, and this was my proxy for crying. Sometimes, I did cry while writing. * Probability of being assigned to do this: ⅓ * Meditation - okay, so this isn’t actually an activity that’s evidenced to complete the stress cycle, but it is relaxing and good for you, so I included this in the experiment. I operationalized meditation as listening to a guided body scan for at least 10 minutes before going to sleep. * Probability of being assigned to do this: ½
These two heat maps show the assignment to activities for the 113 days of the experiment included in the final data set:
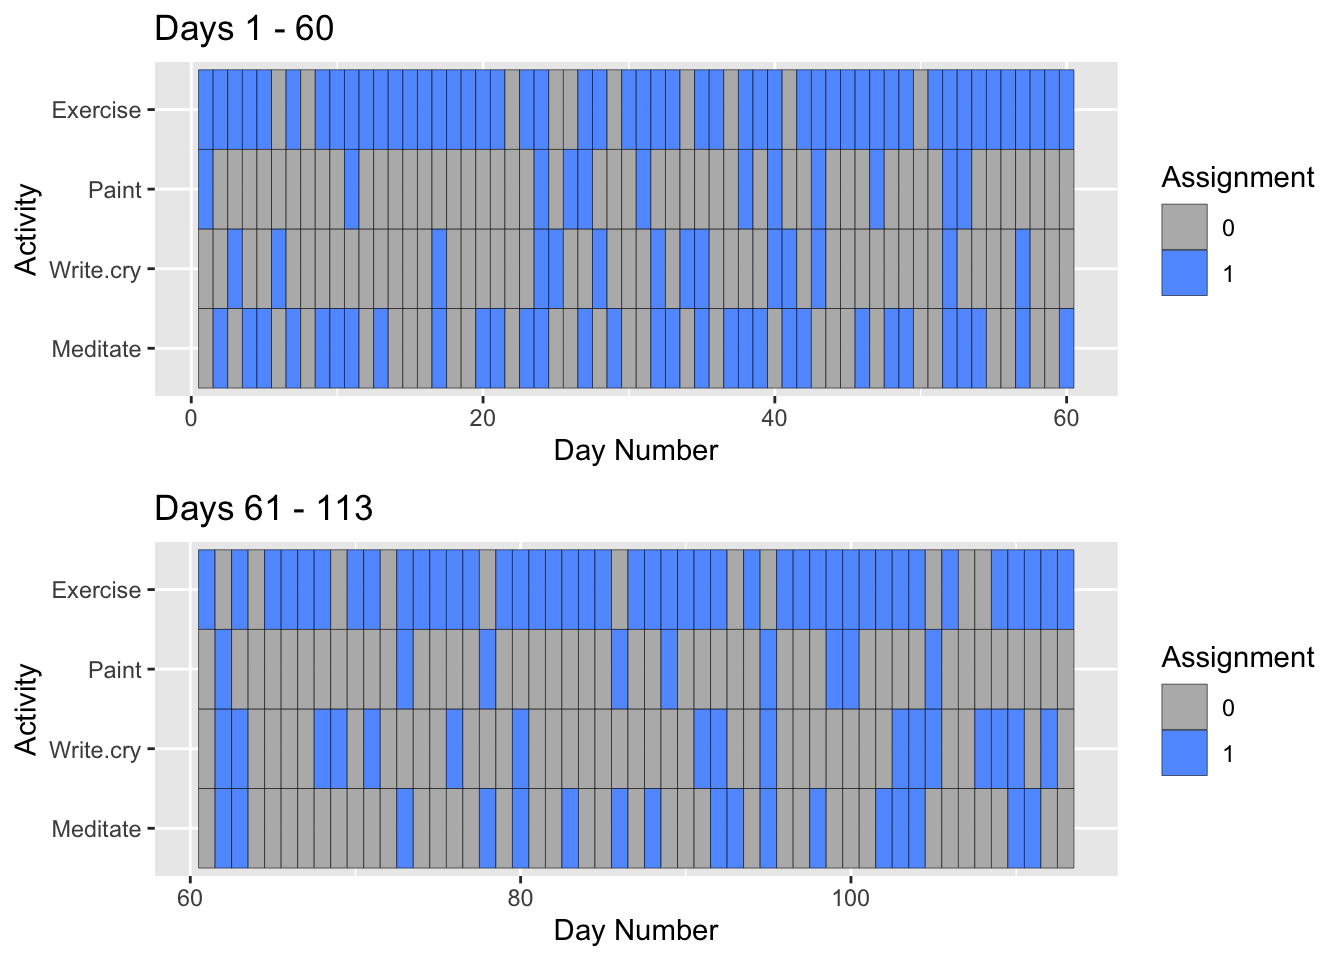
I wrote an R script to perform the randomization and ran the script each morning, except on my designated day off each week. Each of these activities was a separate randomization, so some days I was assigned to do none of them (such as day 8), and other days I was assigned to do all 4 (such as day 24). I randomized myself for each day on that day, which meant I couldn’t plan ahead and set aside time for activities. The benefit of this approach was that I knew future assignments weren’t influencing previous nights’ sleep. I took this rule very seriously and stuck to it, even when I had to tell friends there was a ⅚ chance I could go for a walk with them the next day, but in the ⅙ chance I was randomized not to exercise, how would they feel about a picnic instead?
The Outcome Variable
The outcome variable I chose was the number of minutes I spent awake/restless during the night according to my Fitbit. I chose this variable because it is relatively unbiased – it’s not based on my subjective impression of the night, which could easily be influenced by that day’s assignment, which I always knew.
Limitations
Low Power
Since I was assigned to physical activity with a probability of ⅚ and creative expression with a probability of ⅙, there weren’t very many days when I did not exercise or when I did paint. This diminished my power to detect effects for these activities. Based on my power calculations, I should really have run this experiment for a few years in order to have a high likelihood of detecting moderate or small effects with statistical significance. But, I missed being able to choose what I did every day, so I ended the experiment after collecting data for 113 days.3 I also excluded a few data points on days when my Fitbit did not detect sleep stages.
Participant Nonobservance
Since the assignment was truly random, but my actual behavior was subject to all the pitfalls and correlations of human choice, I measured the effect of the assignment to activities, not whether I actually did the activities4. I knew I needed to adhere to the assignment in order to detect an effect, so I did my best, but some days I just didn’t have time to paint. Other days, I really needed to walk somewhere. I did a pretty good job adhering to the write/cry and meditation assignments, but nonobservance likely watered down any effects of physical activity and creative expression.
I knew the assignment
There was no way for me to not know what activities I had been assigned to. I doubt this had much of an effect, but it is a downfall of the study design.
Assumptions
The study design relies on a few key assumptions. Since I tested the effect of all 4 activities in one model and didn’t include interaction effects,5 this design relies on the assumption that I always had stress to process and these 4 activities had an additive effect on the stress processing. If, for example, exercising caused me to totally complete the cycle for all my stress, then the effect of meditation would differ based on whether I had already exercised that day. My model didn’t account for this possibility. However, I think it’s probably not so far from the truth that I encountered stress every day and wasn’t running out of stress to process, even when I did multiple activities in one day.
Since I measured the effect of the activities on that night’s sleep and did so on consecutive days, the study also assumes that the effect on sleep is immediate but that the activities don’t affect sleep on subsequent nights.
Exploring The Data
Here’s a histogram of the outcome variable, minutes awake according to my Fibit:
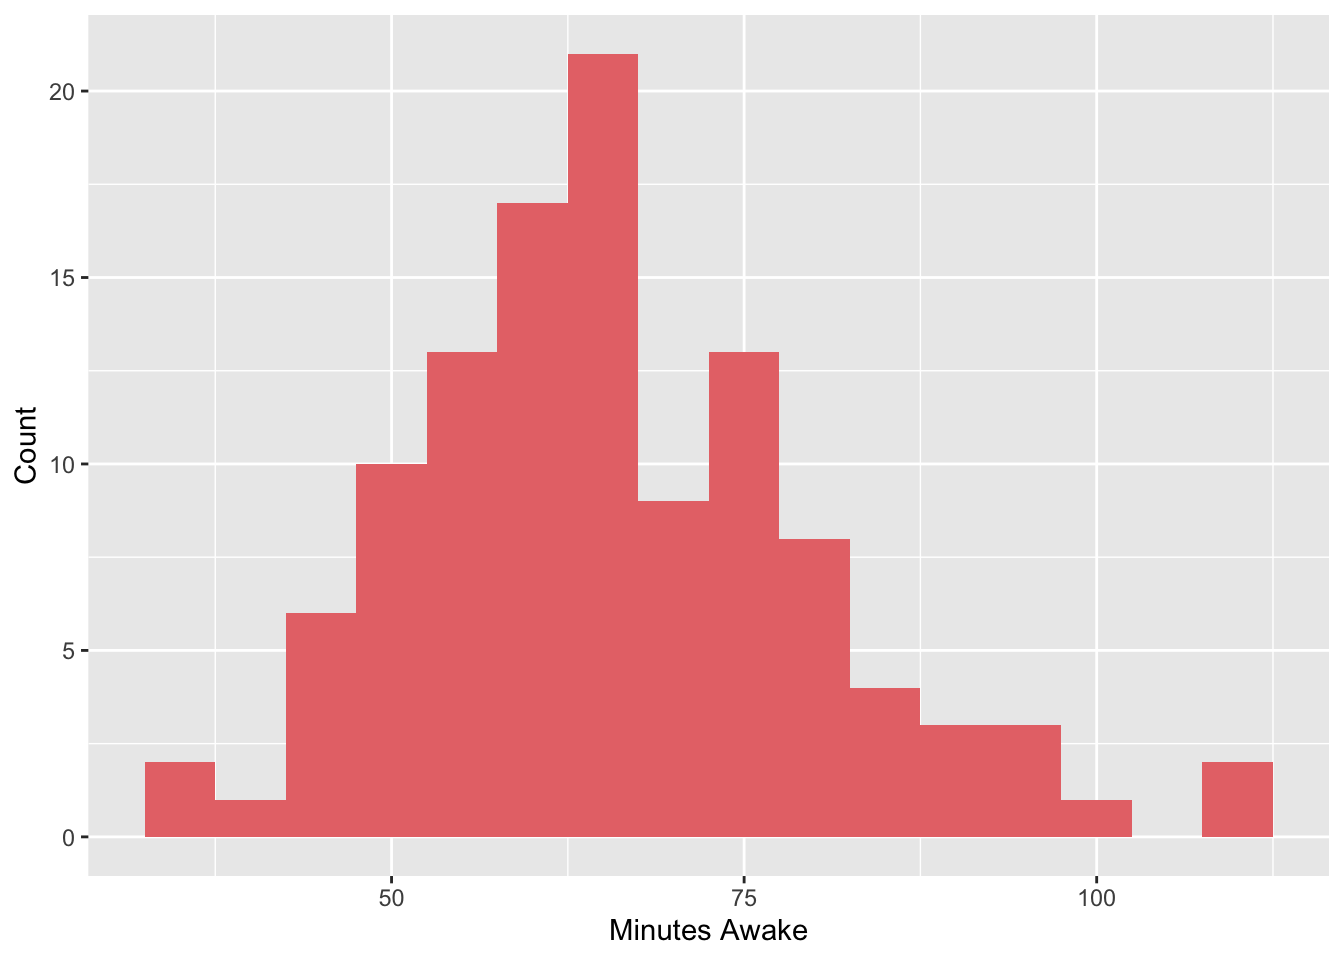
Okay, so this seems like many, many minutes awake. Fitbit also includes in this count minutes for which it perceived me to have been “restless,” so the numbers tend to be much higher than the actual amount of time I remember being up in the middle of the night.
Just for fun, let’s explore the minutes awake by day of the week:
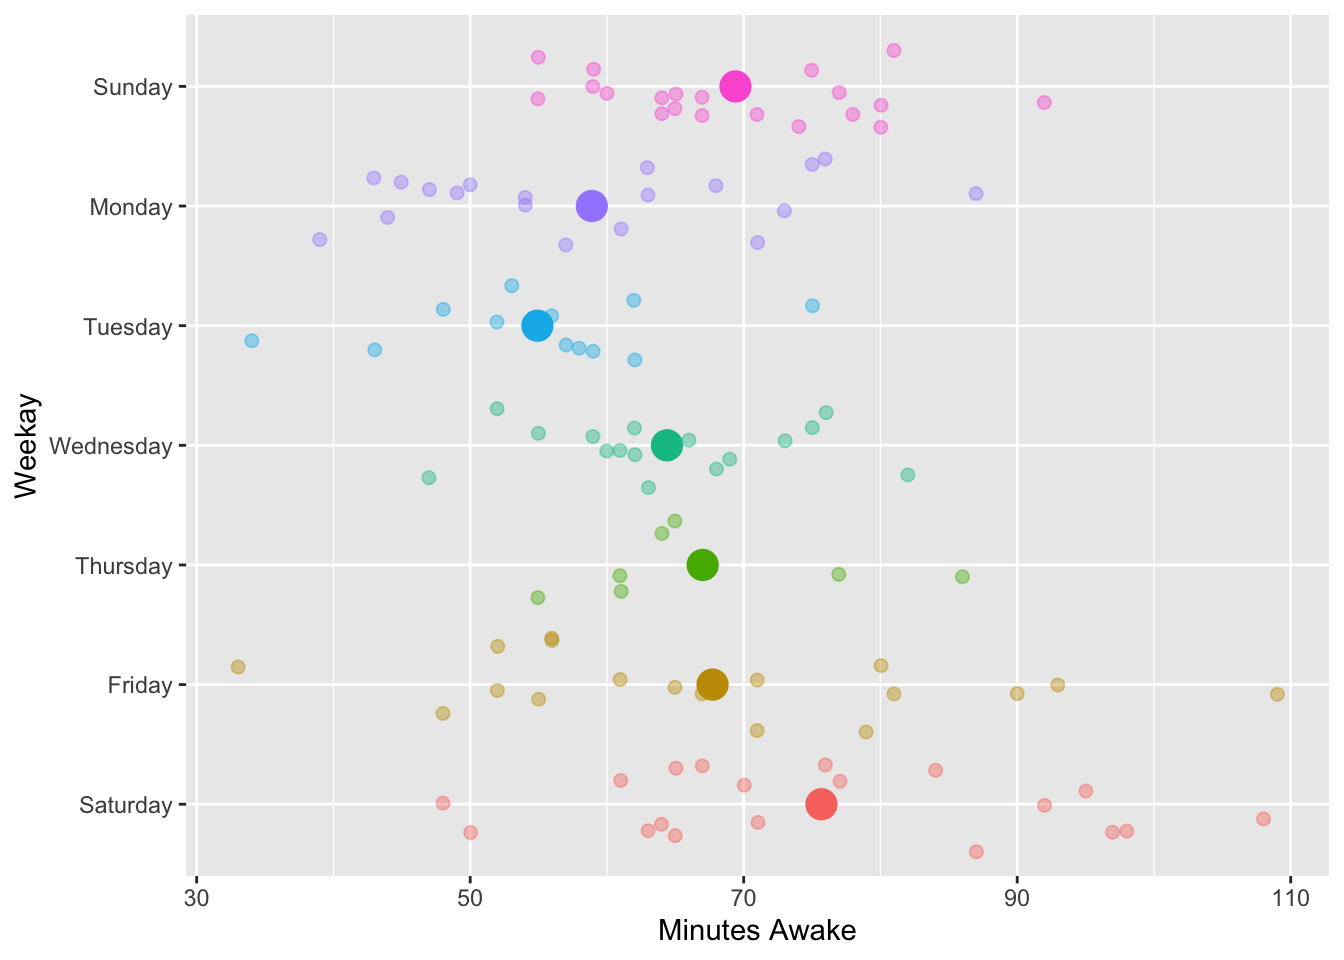
The large dots show the mean for each weekday. Since I tend to sleep more on weekends, let’s also graph the minutes awake divided by the minutes asleep by day of the week:
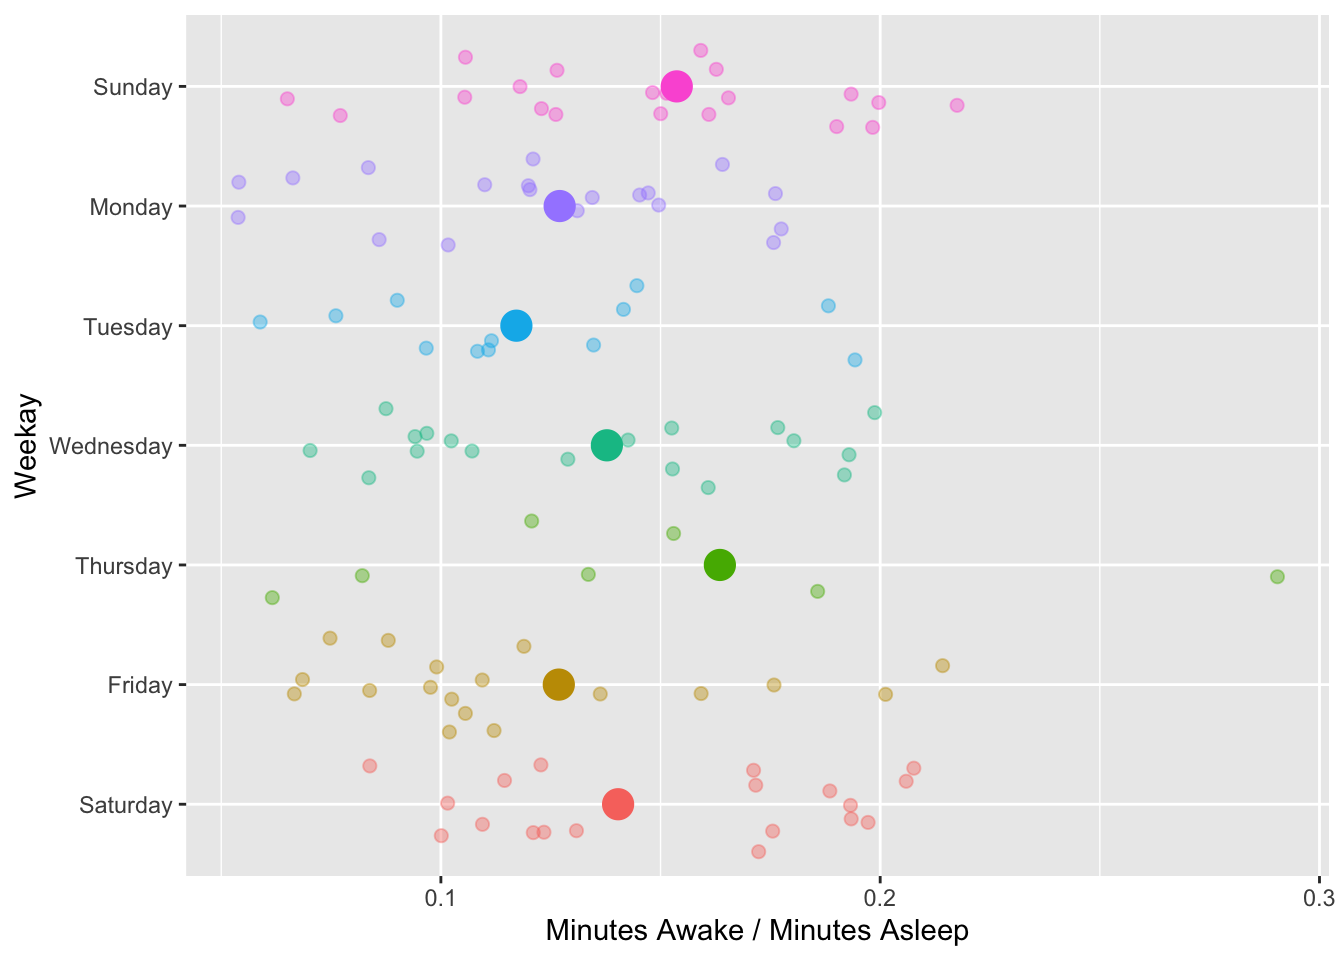
Now Friday and Saturday nights look more similar to the other nights. It doesn’t surprise me that Sunday nights, heading into the work week, seem to have a higher awake to asleep ratio, though I didn’t test whether this is a statistically significant difference. Most weeks, Thursday was my “day off,” so I have less data for that weekday.
Since I struggled not to exercise on days I was assigned not to, let’s check out the number of steps I walked on days I was and was not randomized to exercise, to see how well I succeeded in walking less on non-exercise assigned days:
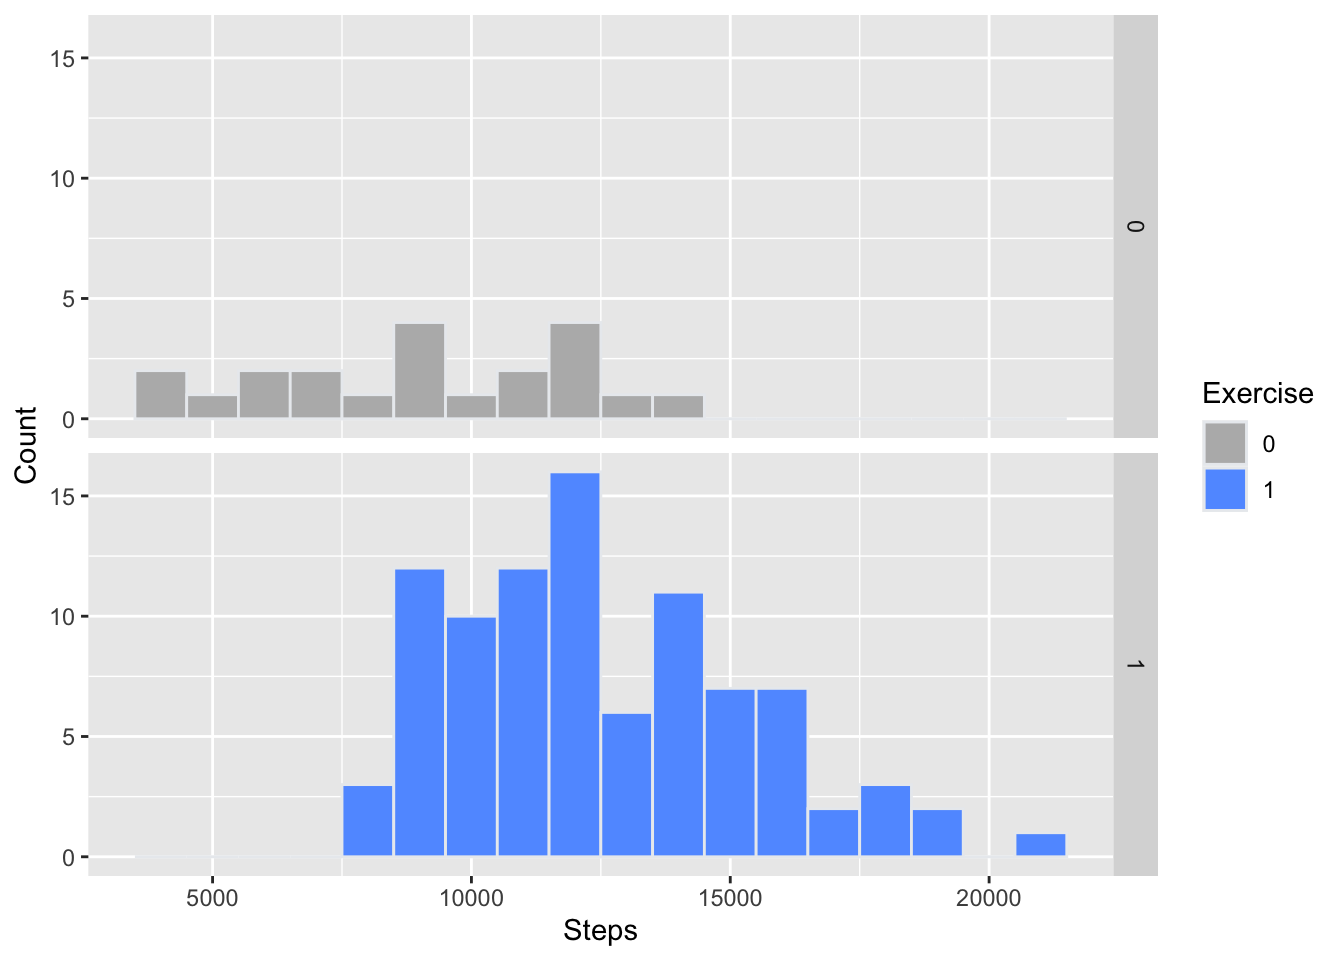
I did tend to walk more on days I was randomized to exercise, but there’s significant overlap in the distributions and there aren’t many days when I was randomized to not exercise.
Univariate Models
Okay, now let’s explore the relationships between the actual outcome variable, minutes awake, and the 4 independent variables, assignment to exercise, paint, write/cry, and meditate. First, univariate analyses. I’ll run a regression of minutes awake on each of the activity assignments separately. Then, I’ll include those for which p < .2 in a multivariate model.6 I’ll also visualize the minutes awake broken down by assignment for each activity using a violin plot, which shows the shape of the distribution, and the individual data points plotted with random noise so they can be differentiated from each other.
First, exercise:
##
## Call:
## lm(formula = Minutes.Awake ~ Exercise, data = s)
##
## Residuals:
##     Min      1Q  Median      3Q     Max
## -32.804  -9.804  -1.804   9.196  43.196
##
## Coefficients:
##             Estimate Std. Error t value Pr(>|t|)
## (Intercept)  66.5238     3.1985  20.798   <2e-16 ***
## Exercise1    -0.7195     3.5448  -0.203     0.84
## ---
## Signif. codes:  0 '***' 0.001 '**' 0.01 '*' 0.05 '.' 0.1 ' ' 1
##
## Residual standard error: 14.66 on 111 degrees of freedom
## Multiple R-squared:  0.000371,   Adjusted R-squared:  -0.008635
## F-statistic: 0.04119 on 1 and 111 DF,  p-value: 0.8395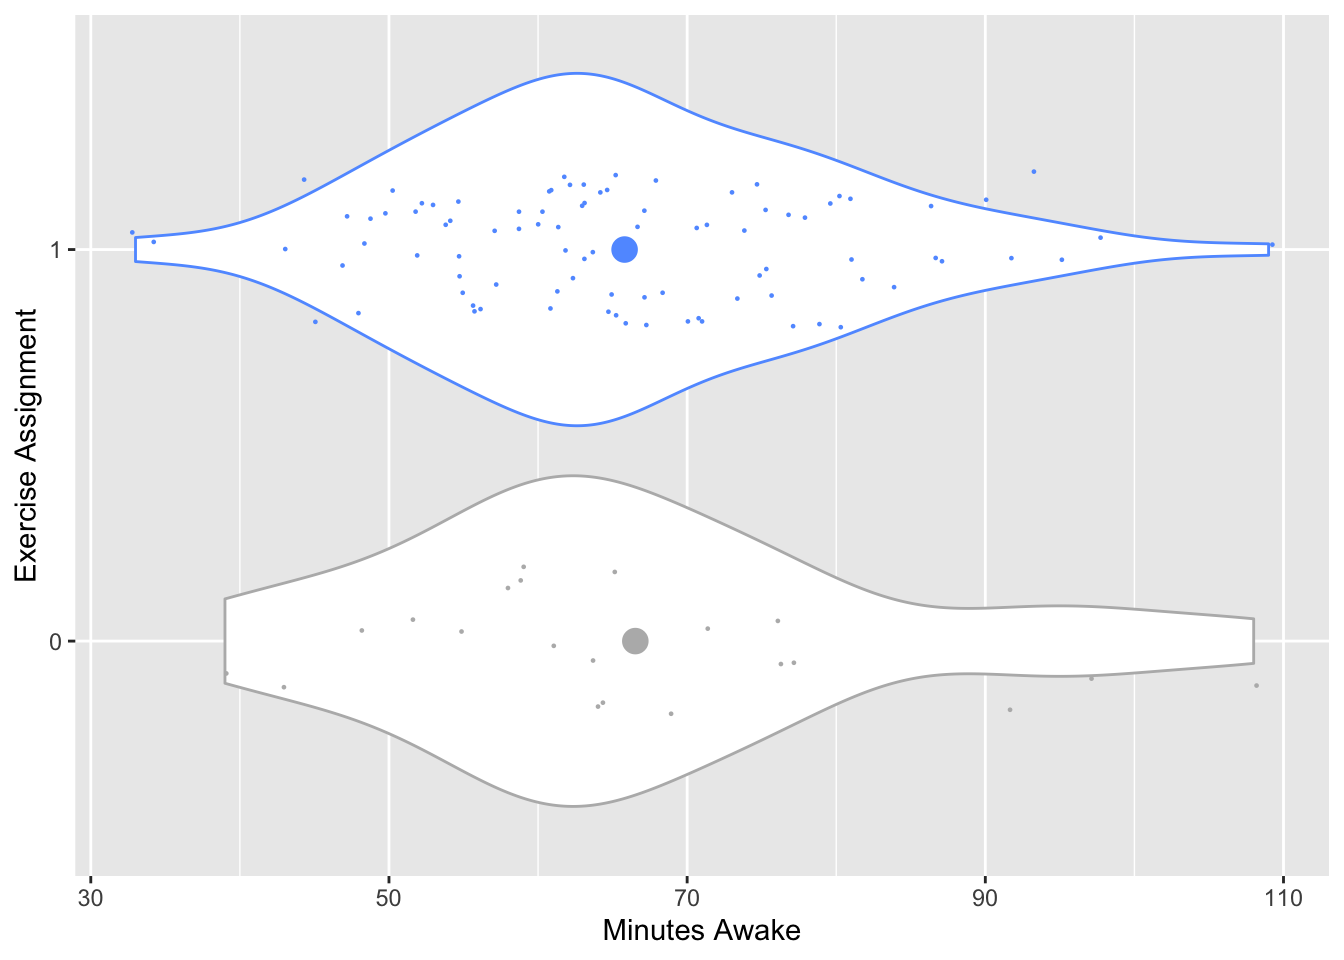
The p-value for exercise is .84 and the distributions of minutes awake for the days I was and was not assigned to exercise appear to be about the same. There is a lack of evidence that being assigned to exercise impacted minutes awake.
Onto painting:
##
## Call:
## lm(formula = Minutes.Awake ~ Paint, data = s)
##
## Residuals:
##     Min      1Q  Median      3Q     Max
## -33.022 -10.022  -2.022   8.978  42.978
##
## Coefficients:
##             Estimate Std. Error t value Pr(>|t|)
## (Intercept)  66.0217     1.5283  43.199   <2e-16 ***
## Paint1       -0.4503     3.5452  -0.127    0.899
## ---
## Signif. codes:  0 '***' 0.001 '**' 0.01 '*' 0.05 '.' 0.1 ' ' 1
##
## Residual standard error: 14.66 on 111 degrees of freedom
## Multiple R-squared:  0.0001453,  Adjusted R-squared:  -0.008862
## F-statistic: 0.01613 on 1 and 111 DF,  p-value: 0.8992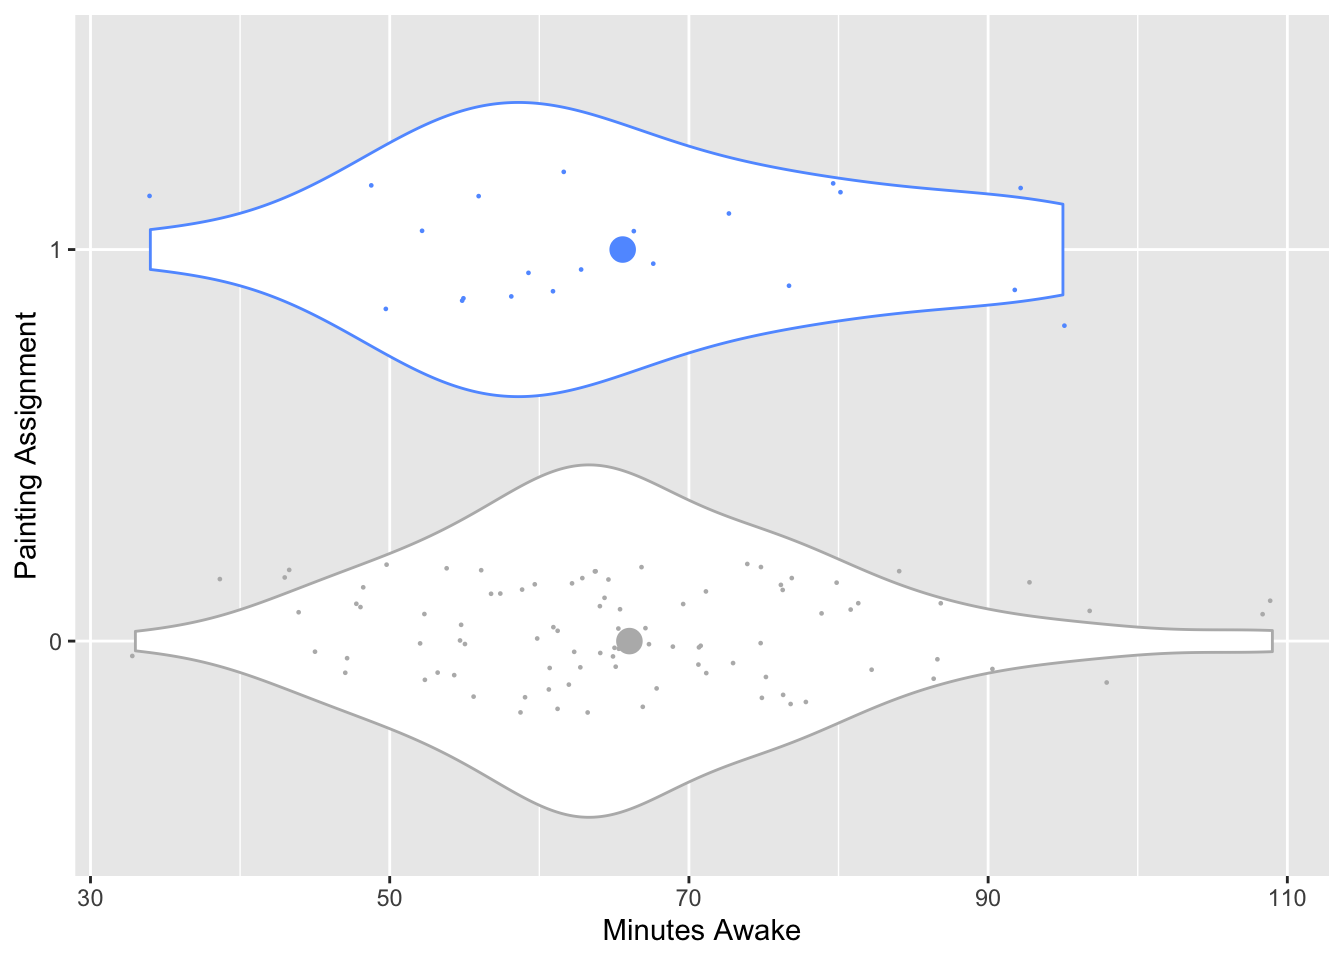
Once again, painting assignment does not appear to influence minutes awake.
Next, writing/crying:
##
## Call:
## lm(formula = Minutes.Awake ~ Write.cry, data = s)
##
## Residuals:
##     Min      1Q  Median      3Q     Max
## -35.012 -10.012  -1.452   8.988  40.988
##
## Coefficients:
##             Estimate Std. Error t value Pr(>|t|)
## (Intercept)   68.012      1.575  43.190   <2e-16 ***
## Write.cry1    -7.561      3.007  -2.515   0.0133 *
## ---
## Signif. codes:  0 '***' 0.001 '**' 0.01 '*' 0.05 '.' 0.1 ' ' 1
##
## Residual standard error: 14.26 on 111 degrees of freedom
## Multiple R-squared:  0.0539, Adjusted R-squared:  0.04538
## F-statistic: 6.324 on 1 and 111 DF,  p-value: 0.01334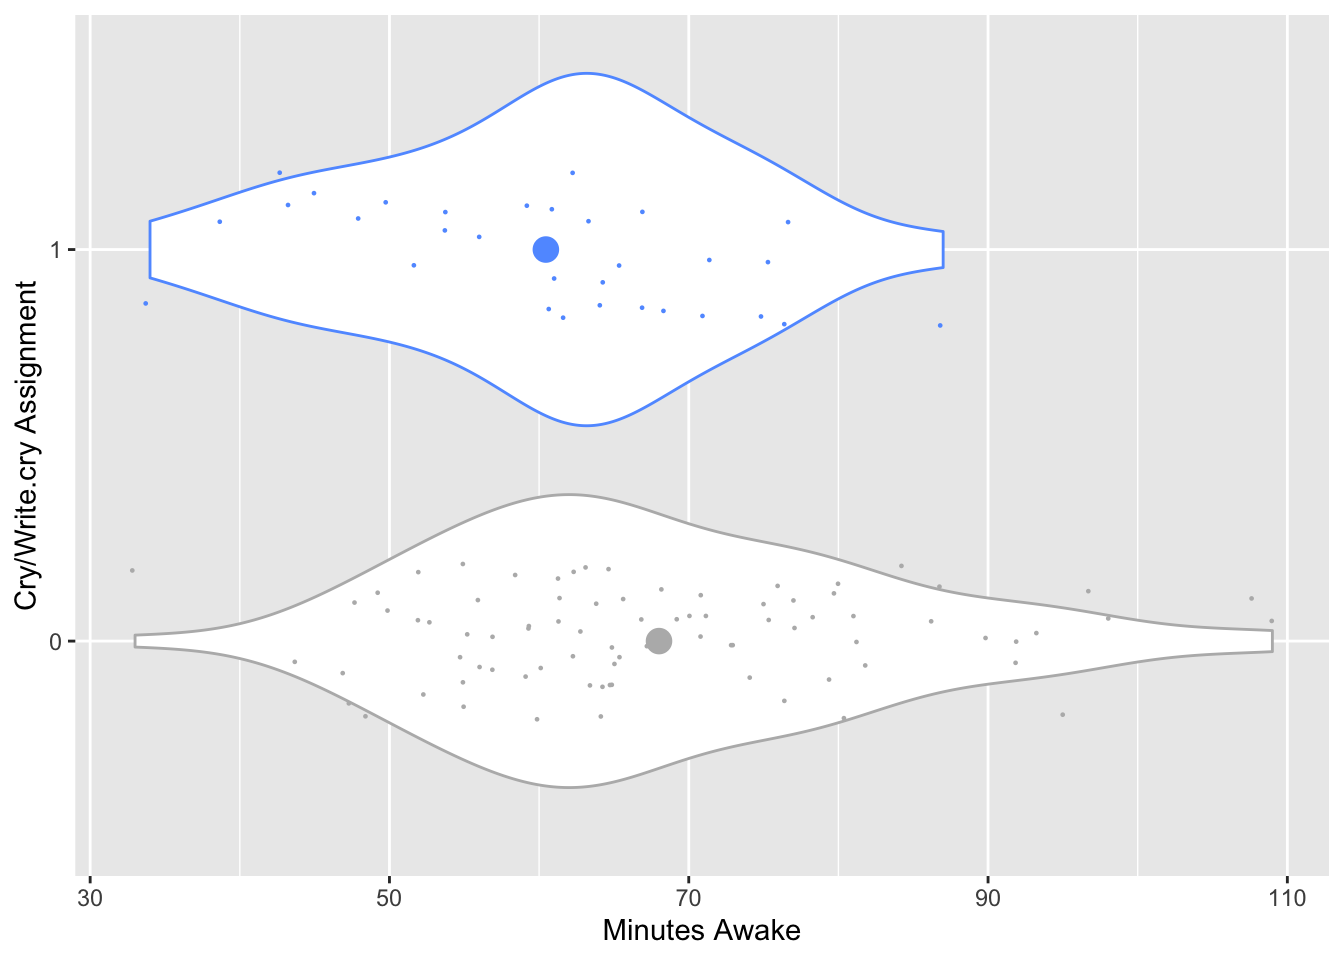
Wow! Write/cry assignment is associated with minutes awake with p = .013. That means, in a world where write/cry assignment didn’t impact minutes awake, we’d expect to see a difference at least this large by chance only 1.3% of the time. In the graph, the distributions of minutes awake also appear strikingly different on days I was and was not assigned to write/cry. I was awake for less time when I was assigned to write/cry (95% confidence interval: [-13.51818, -1.602989] minutes).
Finally, meditation:
##
## Call:
## lm(formula = Minutes.Awake ~ Meditate, data = s)
##
## Residuals:
##     Min      1Q  Median      3Q     Max
## -33.108  -9.354  -2.108   8.646  41.892
##
## Coefficients:
##             Estimate Std. Error t value Pr(>|t|)
## (Intercept)   67.108      1.810  37.068   <2e-16 ***
## Meditate1     -2.754      2.778  -0.991    0.324
## ---
## Signif. codes:  0 '***' 0.001 '**' 0.01 '*' 0.05 '.' 0.1 ' ' 1
##
## Residual standard error: 14.6 on 111 degrees of freedom
## Multiple R-squared:  0.008775,   Adjusted R-squared:  -0.000155
## F-statistic: 0.9826 on 1 and 111 DF,  p-value: 0.3237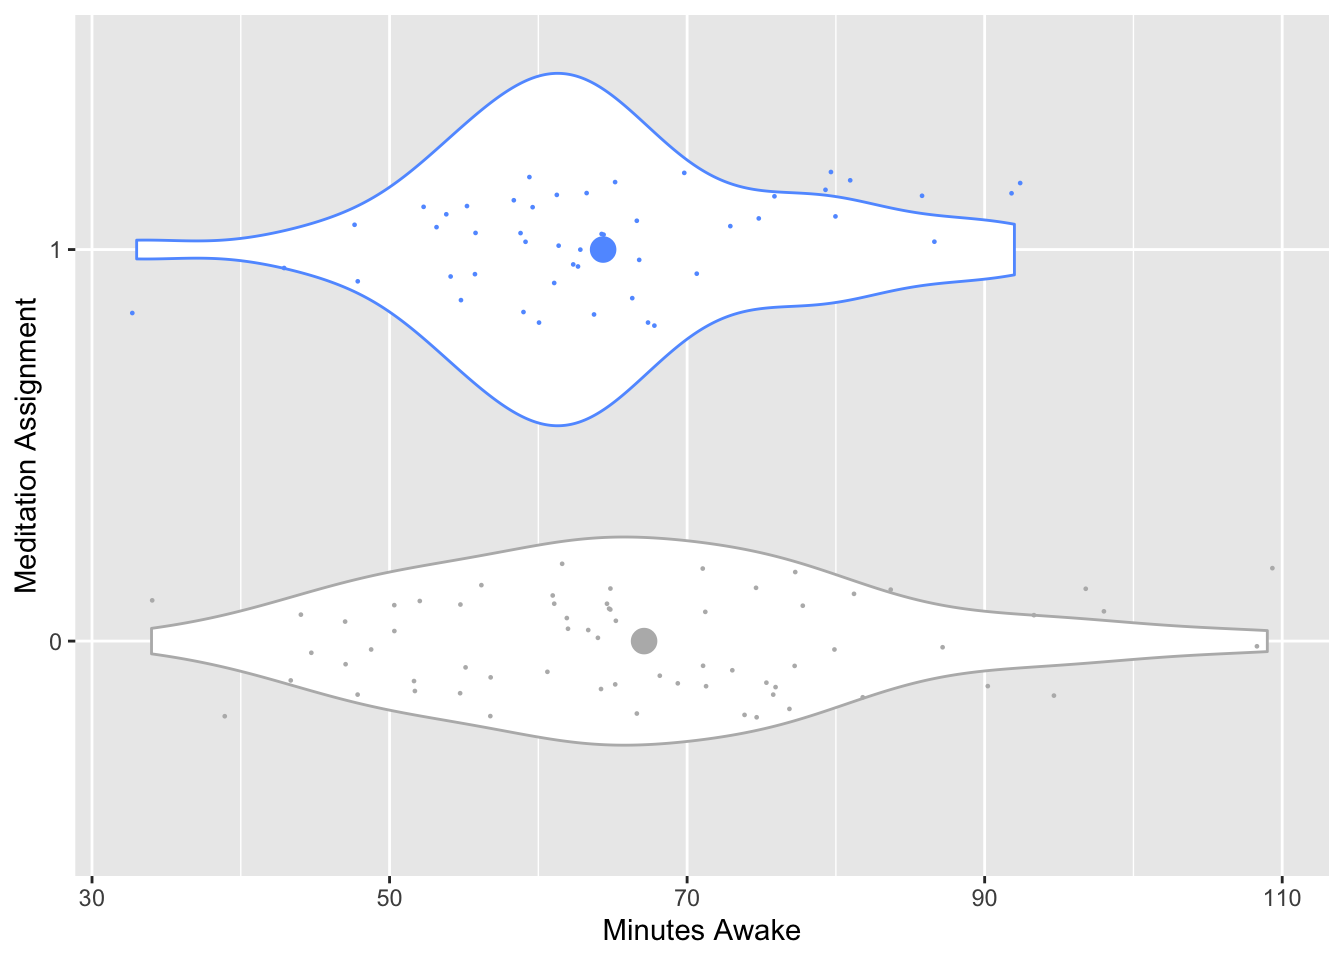
Although it appears from the graph that meditation might be associated with fewer minutes awake, the p-value (p = .32) reveals that it wouldn’t be very surprising to see this amount of difference by chance if meditation didn’t influence minutes awake. That being said, the largest 6 values of minutes awake are all on days I was assigned not to meditate. This wasn’t one of the tests I planned on running so I won’t analyze this statistically, nor can I conclude that this is a causal effect, but it could be that meditation helps prevent the worst of the “bad” nights.
Multivariate Model
Since write/cry assignment is associated with minutes awake at p < .2, I will put it into a multivariate linear regression model controlling for other variables that likely impact minutes awake7.
I will include weekday in the model to control for any weekly trends, such as tending to be more tired at the end of the work week.
I’ll also include minutes asleep in the model, since more sleep means more potential minutes to be awake during the sleep.
Finally, COVID was declared a pandemic and I started working from home partway through the study period. This changed my routine, my daily stressors, and the availability of other ways to complete the stress cycle (so long, readily available affection and positive social interaction). To account for these changes, I added a binary “WFH” variable to the model. The WFH variable is 0 before I started working from home and 1 afterwards.
I verified that each of these variables was associated with minutes asleep at the univariate level.
Since the data here are time series, we need to investigate whether there is a relationship between data points that are temporally close to each other and control for this if there is a relationship. Often, consecutive values of time series data tend to be similar to each other. For example, the temperature one day is likely to be similar to the temperature the next day. Below, I graph the correlation between data points with various “lags” in days. A lag of 1 means the data points are from consecutive days, a lag of 2 means they are 2 days apart, etc. I graphed the lags through 6 because we would expect a correlation between days with lag 7 because they are the same day of the week.
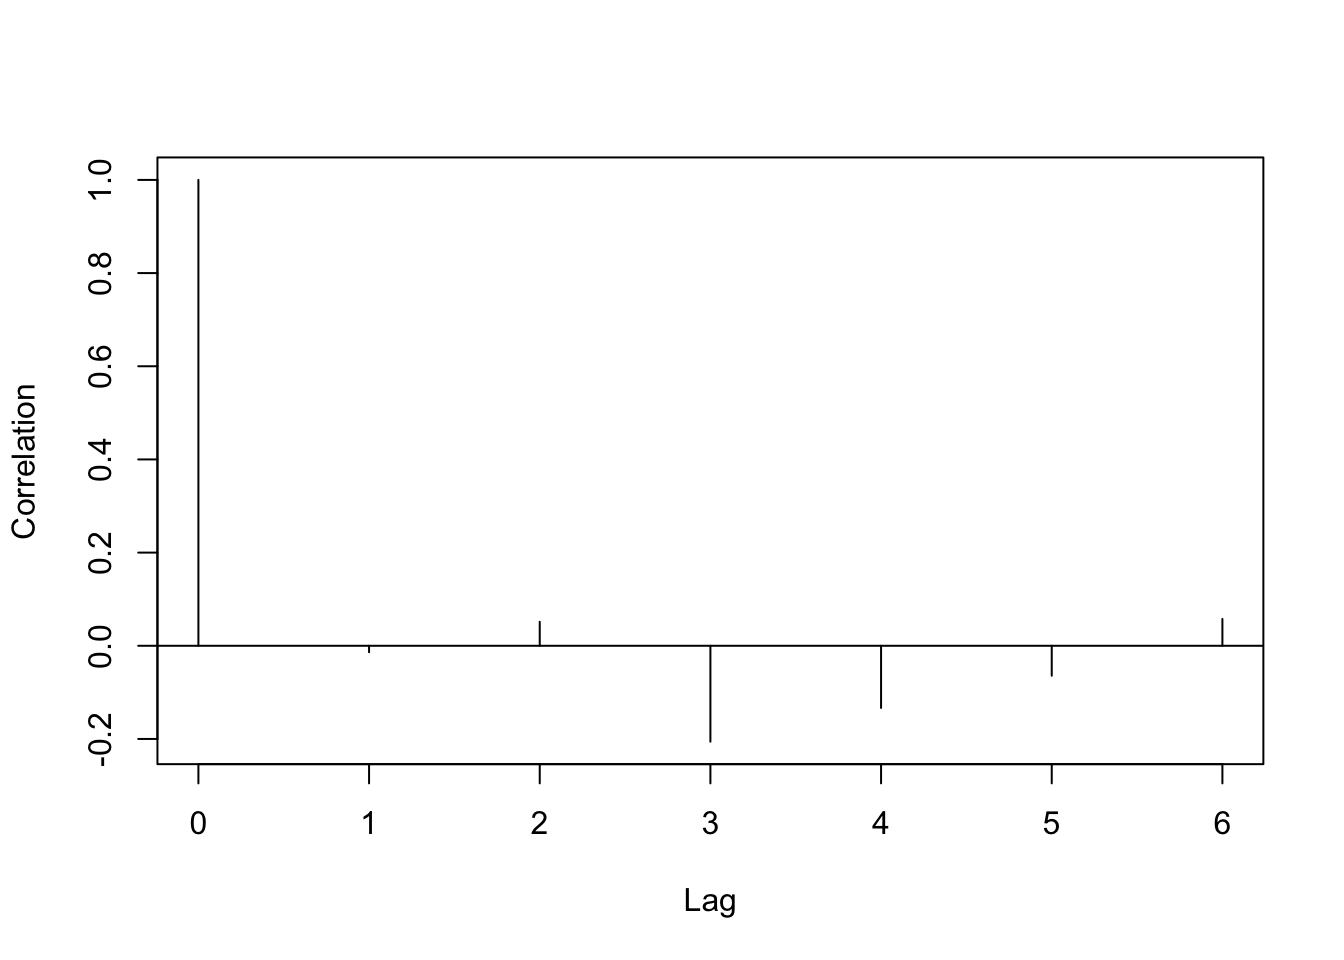
Following the 0 lag (perfect correlation of a data point with itself), none of the correlations are statistically significant. Thus, I won’t worry about correcting for the time series nature of the data.
The final model is a multivariate linear regression model with response variable minutes awake and predictors weekday, minutes asleep, WFH, and of course, write/cry assignment.
Before diving into the model results, let’s verify that this model is a good fit and the data don’t violate the model assumptions. I’ll start by plotting the residuals and fitted values. If the assumptions hold and the model fits well, we hope to see a patternless cloud of data points.
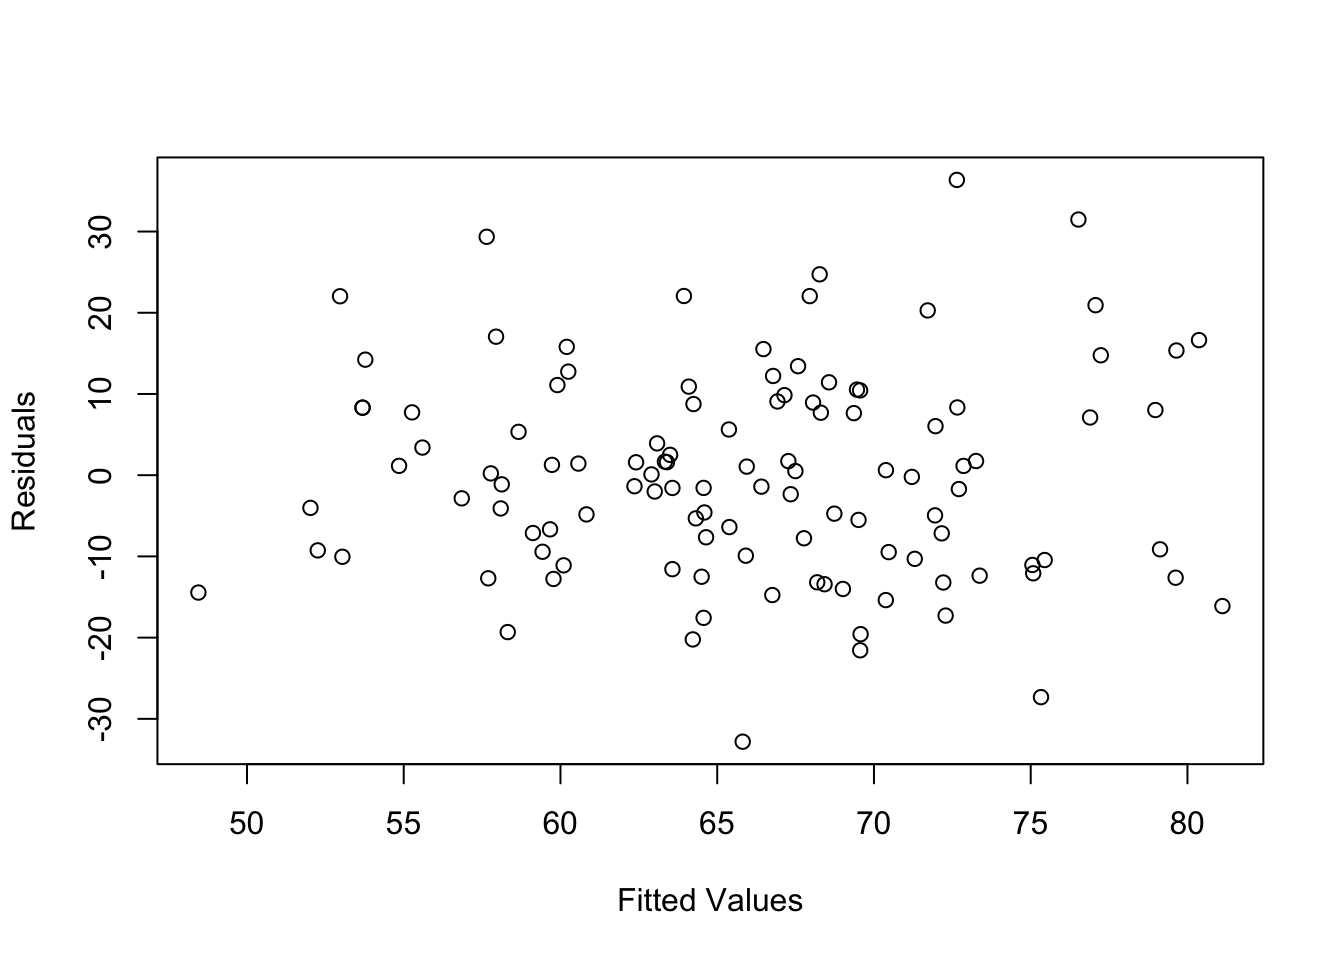
Gorgeous.
Here are the model results:
##
## Call:
## lm(formula = Minutes.Awake ~ Write.cry + Weekday + WFH + Minutes.Asleep,
##     data = s)
##
## Residuals:
##     Min      1Q  Median      3Q     Max
## -32.813  -9.912  -0.208   8.341  36.356
##
## Coefficients:
##                   Estimate Std. Error t value Pr(>|t|)
## (Intercept)       62.02585   16.84707   3.682 0.000371 ***
## Write.cry1        -5.85363    2.91126  -2.011 0.046972 *
## WeekdayFriday     -8.27202    4.38542  -1.886 0.062078 .
## WeekdayThursday   -5.37382    6.82998  -0.787 0.433206
## WeekdayWednesday  -9.61836    4.90689  -1.960 0.052677 .
## WeekdayTuesday   -18.53772    5.40691  -3.429 0.000874 ***
## WeekdayMonday    -13.46237    4.94280  -2.724 0.007586 **
## WeekdaySunday     -4.07963    5.04049  -0.809 0.420167
## WFH                3.27549    2.58154   1.269 0.207367
## Minutes.Asleep     0.02486    0.03060   0.813 0.418285
## ---
## Signif. codes:  0 '***' 0.001 '**' 0.01 '*' 0.05 '.' 0.1 ' ' 1
##
## Residual standard error: 13.29 on 103 degrees of freedom
## Multiple R-squared:  0.2375, Adjusted R-squared:  0.1709
## F-statistic: 3.565 on 9 and 103 DF,  p-value: 0.0006861
Write/cry assignment significantly predicts minutes awake during the night! The important line in this output is the one in the “coefficients” section that reads “Write/cry1.” The p-value here is 0.047, which indicates statistical significance. The estimate is -5.85 (95% confidence interval: [-11.6, -0.0798]), which means that being assigned to write/cry is associated with being awake for about 5.85 minutes less time than if I didn’t write/cry.
Conclusion
Writing/crying does indeed seem to cause me to sleep better. You might be wondering, is it worth it? The causal effect of writing/crying is estimated at about 6 minutes less time awake during the night, and I certainly spend more than 6 minutes writing/crying. For one thing, how long I spend awake at night is just one way of quantifying my level of stress, and effectively completing the stress cycle probably has positive effects on many other aspects of my life that aren’t as easy to measure. Also, writing/crying is a way of processing my experiences and feelings and being present with myself, and that’s something I realized I really value.8
The data collected did not provide evidence that exercise, painting, or meditation caused me to be awake for less time during the night. As previously discussed, this doesn’t mean they don’t have this effect, but my experiment failed to detect a significant effect.
Technically, I was testing 4 hypotheses in this experiment, one for each activity, so I should have corrected for these multiple comparisons,9 but for one person with no ability to compensate herself for her efforts, I am sufficiently satisfied with the longevity and power, and confident with the findings.
Reflections
Although I would have told you I deeply understood causality before beginning this experiment, the process of randomizing myself to conditions led to new levels of insight.
I wrote and painted and meditated more! Being randomized to do activities that were good for me but sometimes hard to actually get started on was a surprising source of motivation and ultimately joy. I couldn’t put these activities off for very long, because once I was assigned to do something I knew, “it’s today or never,” so, I got going. This experiment was an unexpected catalyst to better execute my intentions.
I was really invested in this experiment, and wasn’t actually limiting my own agency, as I was the mastermind behind the whole thing. Yet, it was still frustrating and challenging to be told what to do and especially to be told what not to do! A few times, I was randomized to not exercise multiple days in a row, and just wanted to go outside and move my body. Other times, something would be on my mind that I wanted to write about, and day after day I would feel disappointed that I was randomized not to sit down and let it all out. As someone who works in research, this was a really valuable experience. We ask participants to change their behavior for us all the time! If you conduct or consume research, I recommend randomizing yourself. You might be surprised what you find out.
As for my goals to sleep better and better understand myself, I think I accomplished both. Even when I write/cry, I still have POTS, and I still sometimes hear from Michael Barbaro at 4am. But this whole thing served as a good reminder about how much power I do have. Sometimes I’ll write/cry. Sometimes I won’t. And I’ll revel in all the decisions I’m now making, instead of letting my R script make them for me.
P.S. As usual, here’s a link to download my code.
P.P.S. If you would like to receive an email when I publish a new post, please fill out this google form.
Thanks, Michael Barbaro, for being my favorite insomnia companion↩︎
The height of the COVID lockdown was during the experiment, and I wish “affection” and in-person “positive social interaction” had been accessible to me daily, but they were not.↩︎
I stopped after 113 days because I wanted at least 100 degrees of freedom in my final model.↩︎
This is called an intention to treat analysis↩︎
I’d need way more power for that!↩︎
In this instance, the p-value for each activity assignment represents the probability we would see a difference in minutes awake between the do and don’t-do assignment days at least as large as the one we see if the activity assignment didn’t actually impact minutes awake.↩︎
In this case, controlling for these other variables means I’ll also include them in the model. Then, the model finds the best fit for the data using all the predictors. In analyzing the best fitting model, we can see which variation in minutes awake is best explained by these other variables and what’s best explained by write/cry assignment.↩︎
I know what you’re thinking, an epiphany without a randomized experiment to verify the findings? Turns out you can learn things about yourself in other ways, too.↩︎
There goes my dream of publishing these results in Nature.↩︎